(pressing HOME will start a new search)
![]()
![]()
- ASC Proceedings of the 23rd Annual Conference
- Purdue University - West Lafayette, Indiana
- April 1987 pp 127-130
|
(pressing HOME will start a new search)
|
|
THE USE OF COMPUTERS FOR STATISTICAL APPLICATION IN CONSTRUCTION MANAGEMENT
|
Gene
K. Holtorf |
|
The use
of statistical analysis and mathematical modeling has been virtually
ignored by most construction managers, primarily because of time
constraints. This article explores three topics which are of importance
to the construction industry and through the use of the micro-computers
offers suggestions for the implementation of these topics as management
tools for the present day construction manager. |
INTRODUCTION
The
use of mathematical modeling and statistical applications in Construction
Management is a relatively new management tool when viewed in terms of the
history of construction management and construction in general. These techniques
have their roots in military operations research techniques which were first
developed during World War II by British mathematicians and scientists. The
encouraging results achieved by the British and United States military
management teams during the war attracted the attention of post-war industry
management personnel who were seeking to solve complex functional specialization
problems. The first widely accepted mathematical technique was linear
programming and the introduction of the simplex method for solving a system of
linear equations, introduced by George Dantzig in 1947, was instrumental in the
fields advancement. The progress of the field of operations research parallels
to a large degree the development of the digital computer as a system which
could store large amounts of data, quickly and accurately retrieve data and most
importantly perform computations at incredible speeds. The development of the
micro-computer, with data based system software, more reliable retrieval
systems, larger user memory and priced at a rate the average contractor can
afford, has opened up a new area of decision making tools for the construction
industry here to-fore only accessible to large industry and governmental
agencies, who could afford the computers necessary to perform these tasks. The
purpose of this paper is to explore some of the more readily adaptable
operations research and statistical techniques which could be implemented by the
construction industry, Three general areas are are targeted for consideration,
they are:
|
All
three of these areas are presented to undergraduate construction management
majors at the University of Nebraska and the topics will be presented along with
applicable software for implementation.
BIDDING
THEORY
Bidding
for work in the Construction Industry is a fact of life. While most contractors
would prefer to do negotiated work, the vast majority of contractors, at least
in the eastern Nebraska, find that approximately 85-95% of their yearly volume
of work will come from jobs that were won in a competitive bid situation. This
would imply that the bidding process is an important issue to the present day
contractor.
A
recent informal survey of 10 successful, established contractors in the
Omaha-Lincoln (eastern Nebraska) area revealed the fact that none of the
contractors were currently using any mathematical model or statistical analysis
in a bidding situation. This is not surprising. When asked why this was the
case, responses varied from:
|
If
mathematical models are going to be used in bid-Łding analysis by contractors,
these concerns have to be addressed. Change will ultimately come from
within, most likely brought about through the efforts of new graduates. To this
end, educating New construction managers in the use of
mathematical modeling is of supreme importance, however, the old excuses
must be addressed. Let's examine each of the 5 reasons given in their order of
presentation:
|
One
of the course objectives for the Computational Analysis and Methods course at
the University of Nebraska is to examine current literature on Bidding Models,
and to instruct the students in the rudiments of statistical analysis and
mathematical modeling, then apply the mathematical model to a hypothetical bid
situation using a computer generated approach.
There
are 2 main mathematical models of competitive bidding strategies which have been
developed over the past 30 years. The first model was presented by Lawrence
Friedman (Friedman, 1955). This model utilizes a set of B/E (opponent
bid/contractor estimate) ratios, which have been developed over a period of time
when bidding against the same competitor. From this set of data a probability of
winning when bidding against the competitor at a given markup can be determined.
The maximum-expected profit can be determined from a graph which plots the
product of Markup and probability of winning vs markup. Friedman's mathematical
model comes into play when bidding against more than one bidder (a multiple
bidding situation). Friedman states that the probability of winning will be the
product of all the probabilities of winning which would be generated from a
single competitor situation. Thus, if your probability of beating
competitor A was Pa at a certain markup, and your probability of beating
competitor B was Pb at that same markup, then your probability of beating both
competitor A and competitor B at the same time would be Pa x Pb. This concept
Friedman exdented to any number of bidders. Thus the formula:
|
|
This
is precisely the mathematical model gaming theory presents for success based
upon mutually exclusive events occurring at the same time, and no proof
is necessary (i.e. a head coming up on a two-sided coin and a 6 on a die
happening at the same time would be 1/2 x 1/6 = 1/12).
A
second model introduced by Marvin Gates (Gates, 1967) follows Friedman's model
in that a set of B/E ratios for each competitor is formulated, this set of
ratios is grouped and a cumulative freŁquency curve is developed (ogive or
sigmoid) for ease of extracting the probability of winning against each
individual competitor. The mathematical expectancy curve is also developed
according to Friedman's model. The main difference between the two theories lies
in the mathematical model used to determine the probability of winning against
multiple bidders. Gates does not agree that the conceptual bidding situation is
correctly represented as a set of mutually exclusive events but is more closely
approximated by the drawing of a ball from an urn which contains many different
colored balls (the number of balls of each color is representative of the
probability of winning the given competitor has with respect to each of the
other competitors at a given markup). This formula is given by Gates as:
|
|
An
informal argument establishing the validity of this equation as being
representative of the mathematical model it proports to represent is presented
in the Appendix.
Subsequent
authors such as Morin and Clough (1969), Benjamin (1972), Wade and Harris
(1976), and Carr and Sandahl (1978), to name a few (a more complete listing
appears in the list of References) have incorporated parts of one or both of
these models into their models. The purpose of this discussion is simply to
point out the fact that the real difference between these models is the question
of which mathematical model more closely approximates the real world situation.
Which assumption is correct is ultimately an empirical matter that we can and
should test. This is precisely the type of modeling procedure which we try to
impress upon the student. The author's experience with a number of contractors
and designers who have used one or both of the models favors Gates'
interpretation. To this end, a computer program based upon Gates' model was
developed and implemented into the curriculum. This program takes raw data
(input as bids and estimates), sorts and groups the data into classes,
calculates the statistical information (mean, mode, median, standard deviation
etc), constructs is used or not and should not 'prevent a person from
adopting a bid model to assist in the bid generating procedure.
To
summarize, the purpose of presenting this bid model to young future contractors
is to dispell ,the reasons previously presented by various conŁtractors for not
incorporating a statistical approach to the bid process and also to acquaint the
student with some of the steps required when implementing a mathematical model
into a actual situation, keeping in mind that empirical evidence gathered as a
result of utilization of a model may well change the character of the model.
REGRESSION
ANALYSIS
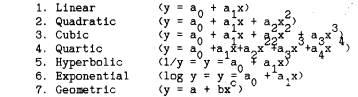
The
one statistical proceedural method which all contractors surveyed stated they
had used was curve fitting and regression analysis. Both curve fitting and
regression analysis lend themselves quite readily to computer application. A
menu driven program was developed for student use which determines the least
squares best fit curve for the following models:
|
|
the
s-curve (ogive) for each single bidder and then constructs the mathematical
expectancy curve and interpolates for the peak, thus determining the optimum
markup for maximum profit. The program also allows for the use of the data bank
to determine the same set of statistical answers when involved in a multiple
bidder situation. Instruction is also given which would allows the student to
devise his/her own program utilizing an electronic spreadsheet such as Visicalc,
Lotus 1-2-3, Multiplan, etc.
Before
implementation of any bidding model takes place the student/contractor must be
aware of proŁblems which frequently are encountered when trying to adapt a
bidding model to the real world situaŁtion, some of these are listed below:
|
The
5 problem areas mentioned, which may pose a problem to implementation of a
bidding model, are problems which should be addressed whether a mode'The output
generated includes S the coefficients of the specified formular (0 <, r <
1), and the standard deviation of the y and x values. Projections using the
regression formula(s) can then be made. Input includes the desired confidence
level and the value of the independent variable and the output is the range of
the dependent ariable as a projected value. The students are also required to
perform some of the calculations on an electronic spreadsheet. This program is
useful for application in cost projections on long-term duration jobs (this is a
requirement on some government contracts), equipment utilization projections,
and work projections based upon past experience. As with all statistical models,
this data can provide the manager with a number or range of expected values
which is superior to the typical "gut feeling" approach so typical of
our industry.
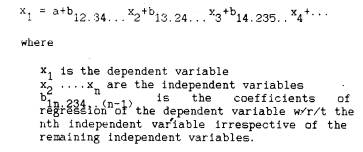
A
by-product of the study of regression analysis is the technique of solving
systems of equations using matrix manipulation, in
particular a Gaussian elimination method. This technique leads to the
presentation of the final regression technique-multiple regression analysis.
That is, a measurement of the association between several independent variables
associated with a single dependent variable. The proceedure is similar to that
for simple correlation with the exception that other variables are added to the
regression equation. Symbolically:
TRANSPORTATION
MODEL
The
third topic which uses a mathematical model in solving a physical problem is the
use of linear programming to solve a problem involving the alloŁcation of
limited resources to minimize cost. This problem is typically known as the
Transportation Model (Assignment model). This model, in its basic form, seeks to
determine a transportation plan which allocates a single commodity to a number
of destinations using a number of sources. The basic assumption of the model is
that there is a direct proportionality between transportation costs and units
transported for a given route. The
transportation model is basically a linear program that can be solved by the
regular Simplex method and as such lends itself to a computer solution. However,
the special structure of the model allows the development of a solution
procedure called the transportation technique that is computationally more
efficient. The beauty of the linear programmŁing approach to problem solving
does not lie in the fact that a single best solution _an be found but in
the sensitivity analysis (what if game`)
|
|
which
can be performed on the set of equations or inequalities of the model. The
optimum solution may not be the most feasible solution and the ,decision making
process is greatly enhanced through utilization of this procedure.
BIBLIOGRAPHY
|
1.
1.
Benjamin, N. B. H., "Competitive Bidding The Probability f
inning,"Journal of the Construction Division, ASCE, Vol. 98.
No. C02, Proc. paper 9218, Sept., 1972,
pp. 313-330. 2.
Carr, Robert I., and Sandahl, John W., "Bidding Strategy
Using Multiple Regression", Journal of the
Construction Division, ASCE, Vol. 104, No C01, March, 1978, pp.
15-26. 3.
De Neufville, Richard, Hani, Elias N., and Lesage, Yves,
"Bidding Models: Effect of Bidder's Risk Aversion," Journal
of the Construction DiviŁsion, ASCE, Vol. 103, No. C01, Mar., 1977,
pp. 57-70. 4.
Dixie,
J. M., "Bidding
Models-The Final ResoluŁtion of a Controversy," Journal of
the Construction Division, ASCE, Vol. 100, No. C03, Proc.
Paper 10790, Sept., 1974, pp. 265-271. 5.
Friedman, L., "A Competitive Bidding Strategy," Operations
Research, Vol. 4, 1956, pp. 104-112. 6.
Fuerst, M., "Bidding Models: Truths and Comments," Journal
of the Construction Division, 7.
ASCE, Vol. 102, No. C01, Proc. Paper 11991, Mar., 1976, pp.
169-177. 8.
Gates, M., "Bidding Strategies and Probabilities," Journal
of the Construction DiviŁsion, Vol. 93, No. COI, Proc. Paper 5159,
Mar., 1967, pp. 75-107. 9.
Gates, M., "Gates' Bidding Model-A Monte Carlo
Experiment," Journal of the Construction Division, ASCE,
Vol. 102, No. C04, Dec,, 1976, pp. 669-680. 10.
Morin, T. L., and Clough, R. H., "OPBID: Competitive Bidding
Strategy Model," Journal of the Construction
Division, ASCE, Vol. 95, No. CO1, Proc. Paper 6690, July, 1969, pp.
85-106. 11.
Park, W. R., "The Strategy of Contracting for Profit," Prentice-Hall,
Inc., Englewood Cliffs, N. J . , 1966. 12.
Rosenshine, M., "Bidding Models: Resolution of a
Controversy," Journal of the Construction
Division, ASCE, Vol. 98, No. COI, Proc. Paper 8753, Mar., 1972,
pp. 143-148. 13.
Shaffer, L. R., and Micheau, T. W., "Bidding with
Competitive Strategy Models," Journal of the Construction
Division," ASCE, Vol, 97, C01, Proc. Paper 8008, Mar., 1971,
pp. 113-139, 14.
Van Der Meulen,
Gysbert J. R., and Money, Arthur H., "The Bidding Game,"
Journal of the Construction Division, ASCE, Vol.
110, No. 2, 15.
June, 1984, pp. 153-.11,54. 16.
Wade, Richard L., and Harris, Robert B., "LOMARK: A Bidding
Strategy," Journal of the Construction
Division, ASCE, Vol. 102, No. C01, Mar., 1976, pp. 197-211. 17.
Willembrock, Jack H., "Utility Function Determination for
Bidding Models," Journal of the Construction
Division," ASCE, Vol. 99, No, C01, July, 1973, pp. 133-153. |
APPENDIX
The
following argument is presented not as a formal proof, but as justification for
the use of the Gates' formula to represent the probability of choosing a certain
colored ball from an urn containing
many balls of various colors.
Assume:
Pa
is the probability of choosing a white ball from a combination of white and blue
balls, Pb is the probability of choosing a white ball from a combination of
white and red balls, and Pc is the probability of choosing a white ball from a
combination of white and green balls. (e.g. Pa = .6, Pb = .7 and Pc = .4). The
problem is to deterŁmine how many white balls, red balls, blue balls and green
balls to put into the urn to satisfy the given conditions. To determine the
number of white balls, the numerators of all probability ratios must be the
same. Then:
|
|
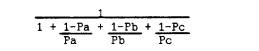
Thus,
the number of white balls can be represented by Pa x Pb x Pc, then the number of
blue balls would be Pb x Pc - Pa,x Pb x Pc, the number of red balls would be Pa
x Pc - Pa x Pb x Pc, and the number of green balls would be Pa x Pb - Pa x Pb x
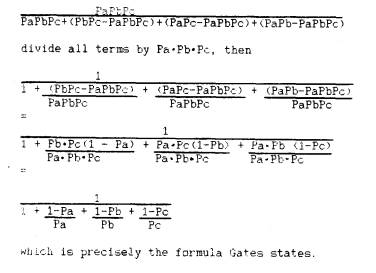
Pc. We then have the probability of choosing a white ball from an urn containing
the white, red, blue and green .ails being
|
|