(pressing HOME will start a new search)
![]()
![]()
- ASC Proceedings of the 27th Annual Conference
- Brigham Young University-Provo, Utah
- April 18-20, 1991 pp 93-102
|
(pressing HOME will start a new search)
|
|
WORKER
SATISFACTION AND COMMUNICATION PATTERN ON CONSTRUCTION JOB-SITES
|
Philip
Udo-In yand Temple
University Philadelphia, Pennsylvania |
| Statistical models showing the relationship between worker satisfaction and interpersonal communication pattern on construction job-sites are presented. Communication variables pertaining to construction job-sites were measured. Data was collected through self-administered questionnaires from craftsmen, including journeymen and apprentices. Subjects were located in the state of Missouri. Communication pattern was indicated by eight variables: method of job assignment, reaction to performance, feedback, accuracy, directionality, overload, distortion of information, and openness. Communication pattern variables were found to be significantly related to construction workers' satisfaction. Accuracy of information received and openness of superiors to workers were two important communication pattern factors in this relationship |
INTRODUCTION
This
study investigated existing modes of interpersonal communication on construction
job-sites and evaluated workers' perceptions and reactions to the different
communication patterns adopted by their foremen and superintendents.
Communication is used mainly to create a working understanding among interacting
individuals or groups. Instructions, rules, regulations, company policy, etc.,
have to be communicated properly to the workers in order for the organization to
function effectively. According to O'Reilly and Pondy [9], objectives of
communication include: to provide information, to obtain information, to make
decisions, to persuade someone, to instruct, to control, to coordinate, and to
express feelings (emotions). In order to achieve these objectives, Kerzner [6]
pointed out that "communication must convey both information and
motivation". Basically, this paper presents the statistical relationship
between construction worker satisfaction and interpersonal communication
variables using multiple regression techniques. Worker satisfaction partially
indicated the worker's perception that communication objectives are being
achieved at the job-site.
COMMUNICATION
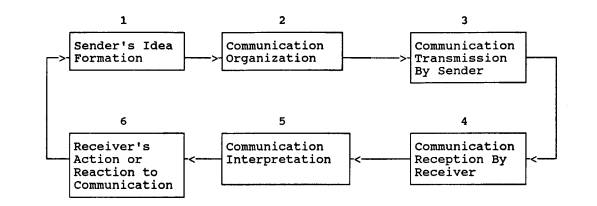
Imundo
[4] defined effective communication as "the transfer of information with
intended meaning in ways that permit those to whom the information is
transmitted to receive, interpret, and act upon it in the way intended"(Fig.
1). The above definition and other definitions of communication involve the
transfer of information rather than the physical phenomena of how communication
is achieved. Tenah [11] referred to information as "the behavior-initiating
stimuli between sender and receiver and in the form of signs that are coded
representations of data. Data does not affect behavior of people or machines;
however, data may become information if behavior becomes affected". McLeod
[7] stated that "information is processed data or meaningful data".
Interpersonal communication, therefore, involves transfer of information that
will affect the behavior of the receiver in the manner intended by the sender.
Successful communication relies upon the proper encoding and decoding of
transmitted information. On the other hand, communication is not achieved when
there is no response from the receiver or the behavior of the receiver does not
correspond to the intentions of the sender.
O'Reilly and Pondy [9] also defined communication process as the
"actual transmission of information from a sender to a receiver, and the
meaning inferred". Transmission of information may be distorted by
interferences or obstructed by barriers. Imundo [4] enumerated different types
of barriers that may affect interpersonal communication in an organization under
three categories, namely: general, upward and downward barriers.
|
|
|
Fiq.1
Communication Process [Imundo, 1980]. |
PREVIOUS RESEARCH
Two
objectives of this study were to determine what type of interpersonal
communication pattern (and barriers) is obtainable at construction job-sites,
and what type of relationship exists between communication variables and worker
satisfaction. Others (mentioned below) have indicated that satisfaction is
related to productivity, therefore, it is important to determine how
communication may
be directly or indirectly related to satisfaction. The Business Roundtable in
its Construction Industry Cost Effectiveness Project Report [13], defined
productivity as a ratio of the output in units of products to the input
resources. Resources may be men, machines, and/or materials. Therefore, reducing
the amount of resources needed (input) to produce a certain unit of output
increases productivity. This indicates that productivity may be increased if
human resources are applied efficiently through effective interpersonal
communication.
Borcherding
[1] found that job satisfaction would help increase productivity of the worker.
Worker satisfaction is an attitude which can be enhanced by different factors.
Possibly, the exercise of effective communication on construction projects, as a
means of efficient utilization of human resources, would ultimately contribute
to increased productivity in the construction industry. Borcherding also noted
that the construction foreman is evaluated by management in terms of job cost
and subjective judgment. Communication skills of foremen have not been
specifically emphasized, unlike technical skills and experience. But, without
good communication skills, a foreman or superintendent cannot favorably
influence the work attitudes of the workers in order to foster productivity [Imundo,
4]. The Business Roundtable [12] also concluded that effective interpersonal
communication with workers may change their attitudes at work. This study was
done to find out how positive changes of attitudes may lead to better worker
satisfaction. In its other report, the Roundtable [13] stated that satisfaction
and performance of the workers are main contributors to increased productivity.
Clampitt [2] surveyed employees from the manufacturing and service industry and
claimed that interpersonal communication dimensions were related to individual
and group productivity. These studies suggest that productivity of construction
workers may be enhanced directly by interpersonal communication or indirectly
through job satisfaction.
O'Reilly
and Roberts [10] developed communication indicators in organizational settings
and a research instrument to measure these indicators. After analyzing data from
different types of subjects, such as military personnel, bank employees,
hospital personnel, etc., O'Reilly and Roberts developed seventeen indicators
for measuring interpersonal communication. Four of the eight communication
variables used in this study were derived directly from O'Reilly and Roberts
communication indicators. The other four variables are modifications of some of
their indicators to make them more applicable to the construction job-sites.
Guevara
[3] conducted the first documented study on communication in the construction
industry. While Guevara's study was directed to office personnel, mostly
managers at the top and middle levels, this study was directed to job-site
workers. Using survey research, Guevara studied the communication pattern
between and among the management levels: top, middle and bottom management. This
work examined interpersonal communication at the foremen-craftsmen level of the
construction industry. At the construction job-site, the superintendent should
establish a communication link with the foremen, who in turn should keep their
craftsmen informed and instructed on what to do. From McLeod's ['7] analysis of
classical management functions and from construction practices, the following
eight characteristics would differentiate job-site communication from
management-level communication: 1) job-site communication are mostly oral and
face-to-face; 2) more people are actively involved in a particular
communication; 3) immediate action is required or instant feedback is necessary;
4) communication breakdowns tend to be more costly to rectify; 5) people
involved in job-site communication come from different educational and
experiential backgrounds; 6) job-site management spends most of its time
directing and controlling construction activities, while top and middle levels
management devotes most of its time to planning and organizing; 7) job-site
management is more concerned with communicating technical matters within the
group (intea-group), whereas the top management primarily communicates
conceptual or strategic matters between groups (inter-group); and 8) job-site
management depends on detailed internal information for its communication, while
the top and middle levels management needs both internal and environmental
information in summary form for its communication. Due to these significant
characteristics, job-site communication should be analyzed and developed
separately from communication at the top and middle levels of the construction
company.
METHODOLOGY
This
work basically examined the relationship between communication pattern on
construction job-sites and communication outcome (Satisfaction) for the workers.
Worker satisfaction (SATISFY) indicated the fulfillment of worker's needs and
expectations through the communication process and also the general job
satisfaction.
Communication
pattern was identified by the following eight factors: 1) Mode of work
assignment (ASSIGN), which refers to the most frequent form in which
instructions are transmitted from the foreman to the worker for the worker to
take action to complete a job; 2) REACTION of supervision to workers'
performance, which involves communication in terms of expression of praises and
reprimands or non-expressions when showing indifference to worker performance;
3) FEEDBACK from communication may be information that is received as a result
of previous information sent out, and which may be based on opinions of others;
4) ACCURACY of communication indicates the similarity between the message that
the sender encoded and transmitted, and the message the receiver ultimately
decoded. Measurement was in terms of respondent's estimate of how accurate
he/she perceives the transmitted information to be; 5) Directionality (DIRECT)
refers to the general indication of the amount of contact the respondent had
with his/her superior on one hand and with his/her co-workers on the other; 6)
Distortion of communication flow (DISTORT) occurs when the nature of the massage
is changed by adding or deleting bits of information transmitted, or when other
things such as noise interfere with transmission of information; 7) OVERLOAD, as
used in this study, indicated two situations, namely, when a worker receives
more information than he/she can effectively use, and when a worker receives
insufficient information to perform his/her work properly; 8) OPENNESS indicated
the willingness of the worker and the opportunity available to communicate
freely with his/her superiors.
Survey
research method was used in this study in which craftsmen responded to 53-item
questionnaires. Some of the items are presented in Appendix 1. The
self-administered questionnaires were distributed to craftsmen as discussed
below, who then responded and returned the questionnaires individually. This
method guaranteed the anonymity and confidentiality of each respondent, and also
eliminated an interruption of work which would have resulted if an interview
format was used. Some questionnaire items were adopted from instruments used in
previous research [O'Reilly and Pondy, 9; Guevara, 3; Clampitt, 2] that measured
similar variables used in this study. Other items were formulated on the basis
of theories, research and construction practice. The draft questionnaire was
then subjected to different stages of development, including expert reviews and
pretest analysis [Udo-Inyang, 14].
A
pilot study was conducted before the main study. Names of a few construction
companies in the State of Missouri were randomly selected from construction
industry directories. Letters requesting permission for their workers to
participate in the survey were sent to the selected companies. Companies that
responded favorably were then forwarded a set of questionnaires to distribute to
their workers. The self-administered questionnaire, with return address and
prepaid postage, was then completed and returned separately by each worker.
Questionnaires were also given to labor union members through their
representatives. Finally, questionnaires were distributed to workers on State of
Missouri projects, which were visited by the authors. On-site interviews were
informal and were not recorded nor included in the data analysis that follows.
RESULTS
AND ANALYSIS
The
complete analysis of the data collected involved a number of statistical
techniques including descriptive procedures for obtaining frequency
distributions, means, standard deviations, etc.; Pearson correlation
coefficients for one-on-one variable relationships; linear regression modelling
together with stepwise and R-square methods for establishing relation between
dependent and independent variables. Statistical Analysis System (SAS) package
on a mainframe computer was used for data analysis.
Demographic Characteristics of the Workers
Sample
size was determined by the sampling method discussed above, which basically mean
that sample size equal to the total number of craftsmen available from the
selected companies and labor unions. In the pilot study, 78 questionnaires were
sent out to three companies from which 47 responses were received for a
60-percent response rate. In the main study, 105 out of 335 questionnaires given
out were received for a 31-percent response. The following are the descriptive
statistics for each of the demographic variables measured in this study.
TRADE:
Nine specific types of construction trades or crafts were identified in the
survey. The major trades that were strongly represented were carpenters,
ironworkers, laborers, and pipe fitters/plumbers, each representing more than
10% of the total respondents. More than one-quarter of the respondents were
carpenters.
UNION:
Over 86% of the workers sampled in this study were members of a trade union.
CREW
SIZE: More
than 42% of the respondents were in a crew consisting of one to five people.
This was followed by those in a crew of six to 10 people (at 36%).
The remaining respondents had more than ten people in their crew. The
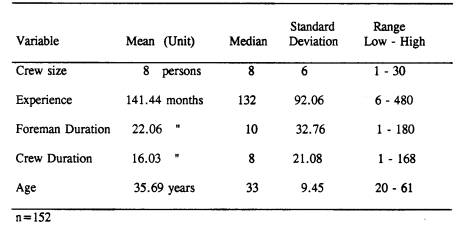
average crew size for all respondents was eight. (Table 1).
|
Table
1. Descriptive
statistics of demographic variables. |
|
|
CRAFT
EXPERIENCE: Respondents had a large range of experience (from six months to 40
years) in their trades. However, most (55%) had 10 or more years of experience
in their trade. Average experience was about 12 years. FOREMAN DURATION:
Respondents had worked with their foreman from a short time of one month
to a maximum of 15 years. However, more than one-half of the workers (53%) had
worked with their foreman for one year or less. The average duration that the
respondents worked with their foremen was 22 months.
CREW
DURATION: Majority of the respondents (61 %) had worked with the same crew for
one year or less, and 90% of them had worked with their crew for two years or
less. The average duration in a crew was 16 months, which suggests frequent
changes in the size and constituency of a construction crew, thus an effective
approach to interpersonal communication on the job-site is required.
AGE:
The age composition of the construction workers who participated in the study
ranges from 20 years to 61 years. About 40% of them were within the age of 21
and 30 years. The average age was approximately 36 years.
SEX:
Most of the workers (96%) that responded were male.
Regression Analysis
This
statistical procedure was used to establish a relationship between the
communication pattern and worker satisfaction. First order linear regression
model was obtained with worker satisfaction (SATISFY) as the dependent variable
and communication pattern indicators as the independent variables. The
independent variables were categorized into two types as:
Qualitative
Variable
The
only qualitative variable in this model was ASSIGN, with five categories:
Assignment sheets (SHEET); Block or task diagrams (DIAGRAM); Photographs or
models (PHOTO); Verbal instructions (VERBAL); and Examples (EXAMPLE). These
categories were measured separately by five items on the questionnaire (Q9-Q13).
Therefore, ASSIGN variable was given values from 9 to. 13 (see below), depending
on which job assignment was most frequently used. In case of a tie from worker's
response, the category with a lower number was assigned.
Quantitative
Variables
Seven
quantitative variables were included in this model: REACTION, FEEDBACK, DIRECT,
DISTORT, ACCURACY, OPENNESS, and OVERLOAD. These variables were each measured by
a number of items on the questionnaire and the value assigned to each variable
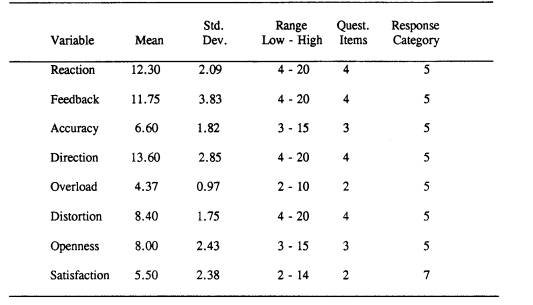
was a summation of responses to items under that variable (Table 2).
Pilot Study
The
first order general linear model obtained from SAS, using all of the above
variables with the data collected in the first survey, was:
 |
| Table
2. Descriptive
statistics of communication pattern variables and satisfaction. |
 |
The
first parameter (bo = 0.4065) in equation (1) is the intercept of the
regression line when the mode of job assignment was either EXAMPLE (ASSIGN= 11)
or DIAGRAM (ASSIGN= 13), as these two dummy variables were not separately
represented in the equation. For other cases, we found that:
| when
ASSIGN = 9, SHEET = 1, then bo = 1.3959, when
ASSIGN = 10, VERBAL = 1, then bo = 1.4892, when
ASSIGN = 12, PHOTO = 1, then bo = 3.1682 |
Hence,
the above model is completely defined by four different parallel hyper-planes.
The variation from one plane to another was non-constant. That is, the change
from SHEET to VERBAL does not correspond to the change from VERBAL to PHOTO or
from SHEET to PHOTO.
The
overall F-test for regression was significant at the 0.0001 level with an
F-value of 7.759. This indicated that there was a statistically significant
relationship between the dependent and the independent variables. R-Square value
was reported at 0.6831, which may be considered statistically high. R-Square is
an estimate of the proportion of the variance of the dependent variable
accounted for by the independent variables [Kerlinger, 5].
The
partial T-tests, to test if bi=0, on each of the estimated parameters
showed that only three were somewhat significant at the 0.05 level of
significance. The coefficients for PHOTO, DISTORT and OPENNESS had T-test
p-values of 0.0538, 0.0017 and 0.0003, respectively. The other variable
coefficients were not significant at this level whereas the overall regression
was highly significant. This suggests the presence of multicollinearity among
independent variables in the model. Multicollinearity occurs when the
independent variables are correlated among themselves, also referred to as
inter-correlation [Neter, et al, 8]. Two variables found to be highly correlated
with other variables were REACTION and FEEDBACK, both of which had the highest
p-value of the T-test at 0.56 and 0.74, respectively. The major effect of multi-collinearity
is that the regression coefficients vary according to the number and type of
independent variables in the model.
The
first order model may not seem to be best fitted for the data at hand, although
the full F-test for regression was quite significant. Transforrhations on the
dependent variable (SATISFY) and on some of the independent variables (REACTION,
DIRECT and OPENNESS) were suggested from results of statistical procedures
conducted, which included analysis of Plots of Y and X's, Residual Plots, and
Univariate Analysis of Residuals [Udo-Inyang, 1989]. After performing analysis
of possible transformations, square-root transformation of the dependent
variable (RSATISFY) was then used to regress on all the original variables plus
three quadratic terms of REACTION, DIRECT, and OPENNESS. The full model had 13
independent variables, including three dummy variables, seven original variables
and three extra variables. The model thus obtained was:
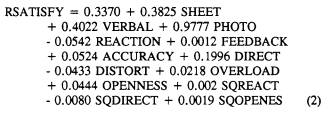 |
Where
SQREACT, SQDIRECT, and SQOPENES are
the quadratic terms of REACTION, DIRECT, AND OPENNESS variables respectively.
The full regression F�test was again highly significant. The R-Square value was
quite high at 0.7144, an increase of about four percent over the R-Square value
for the first order linear model (1). Also, four parameter estimates for the
variables PHOTO, DIRECT, DISTORT, and SQDIRECT were significant in the partial
T-tests.
Stepwise
Methods
Stepwise
regression methods were then applied to reduce the number of independent
variables to include only those that significantly contributed to the variation
of the dependent variable (RSATISFY). Three stepwise techniques (Forward
Selection, Backward Elimination, and Stepwise Regression) from SAS gave
different subsets in terms of number of independent variables selected. The
Forward Selection reduced model with nine independent variables was recommended
due to the high R-Square value (0.7121), which was virtually the same as that
for the fully expanded model with 13 variables. The nine independent variables
were: SHEET, VERBAL, PHOTO, ACCURACY, DIRECT, DISTORT, OVERLOAD, OPENNESS,
SQDIRECT.
R-Square/C
Method
The
R-Square/Cp procedure was also used to select the "best
subset" of the 13 independent variables, by optimization of the R-Square
and Cp values. R-Square value is maximized since it explains the
contribution of the independent variables in the subset to the variability of
the dependent variable. Whereas, Cp is minimized because it indicates
the predictive bias of the model to the data used. The maximum R-Square value of
0.7144 was obtained with all the variables in the model. However, more than 99%
of the maximum R-Square value was obtained with the nine-variable subset, when
R-Square was 0.7121. Considering R-Square only, the best subset contained the
nine variables deduced from the previous stepwise methods. For this same subset,
the Cp value (6.255) was low, and less than p = 9, the number of
variables in the model. Hence, the best nine-variable subset, as obtained in the
Stepwise Regression Methods, was recommended.
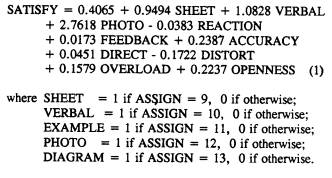
Thus,
from the Pilot Study, the final model adopted to estimate the relationship
between interpersonal communication pattern on the construction job-site and
worker satisfaction was:
 |
From
statistical procedures discussed above, three repeatedly significant independent
variables in the model were ACCURACY, DISTORT, and OPENNESS. ACCURACY
and OPENNESS have positive coefficients, which infers that: 1) satisfaction
of the workers increases with high accuracy of information and instruction
received at work and/or high level of confidence of the workers; 2) worker
satisfaction also increases when the foreman communicated more freely and openly
with the worker and/or when the worker can communicate more freely and openly
with the foreman. DISTORT was negatively related to satisfaction in the model,
indicating that low interference in transmission of message or instruction
improves worker satisfaction, and better understanding of the foreman by the
worker and vice versa also increases worker satisfaction.
Main
Study
Again,
the full regression model was obtained with all the variables using data
collected from the main survey. Stepwise methods of model selection were then
used to produce the best variables combination for a linear fit of the data. The
first order general linear model obtained, containing seven basic independent
variables and two dummy variables, was:
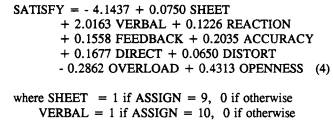 |
The
other three "dummy" variables (EXAMPLE, PHOTO, and DIAGRAM) for the
ASSIGN qualitative variable (i.e., ASSIGN = 11, 12, or 13, respectively) did not
appear in the model due to the very low incidence of observations in these
categories. The first parameter (bo = -4.1437) in equation (4)
represents the intercept of regression line when ASSIGN was either EXAMPLE,
PHOTO, or DIAGRAM, in which case the two other dummy variables (SHEET and
VERBAL) would be zero.
Again,
the overall F-test for the regression was significant at the 0.0001 level with
an F-value of 10.508, indicating that the dependent variable (SATISFY) was
significantly related to the independent variables. The R-Square value was
reported at 0.4989, which may be considered high for a behavioral research. The
partial T-tests on each of the estimated parameters showed that only two were
significant at the 0.05 level of significance. These two were coefficients for
FEEDBACK and OPENNESS, with T-test p-values of 0.0072 and 0.0001, respectively.
All other variable coefficients were not significant at this level, which again
may indicate multicollinearity.
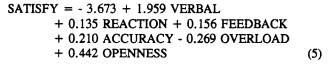
Stepwise Methods
Three
of the nine independent variables appeared in all the final subsets obtained
from the three stepwise procedures. Therefore, these three variables (ACCURACY,
FEEDBACK, and OPENNESS) would basically be considered the most important
variables in the
relationship
of SATISFY
variable with communication variables. The forward selection model (same as
Stepwise regression model) was recommended due to the high R�Square value,
which was about the same as that for the full model with nine variables. The
final model recommended from the stepwise techniques contained the following
variables: VERBAL, REACTION, FEEDBACK,
ACCURACY, OVERLOAD, and OPENNESS.
R-Square/C
Method
Most
subsets suggested in this procedure also contained the three variables
(ACCURACY, FEEDBACK, and OPENNESS) identified in the stepwise techniques as the
most important variables. The maximum R-Square value of 0.4989 was obtained with
all the variables in the model. About 99% of the maximum R-Square value was
obtained with the 6-variable subset, where R-Square was 0.4965. Therefore,
considering R-Square only, the best subset contained the following six
variables: VERBAL, REACTION, FEEDBACK, ACCURACY, OVERLOAD, and OPENNESS. For
this 6-variable subset, the CP value (4.447) was low and also less
than the number of variables in the model. The best 5-variable subset had a CP
value (4.505) which was closer but still lower than the number of variables in
the model. Considering only CP values, the best model would be the
5-variable subset. However, the R-Square value (at 0.4857) was lower than that
for the 6-variable subset (at 0.4965), therefore the best 6-variable subset was
recommended.
The
Stepwise techniques and the R-Square/Cp procedure suggested the 6-variable
model, with R-Square at about 0.5, and the p-value for the overall regression
model less than 0.0001 at F=16.108. This indicates that there was a strong
relationship between the interpersonal communication variables on the
construction job-site and worker satisfaction, as shown in the following
equation:
 |
Equations
(3) and (5) show the relationship between communication factors and worker
satisfaction using the two sets of data obtained. Observed values of
communication variables may be inserted into the right-hand side of the
appropriate model (3) or (5) to obtain the predicted value for satisfaction. But
it is important to note that different sets of data give different coefficients
or parameters. Communication factors appearing in these models should all be
emphasized on the job-site. However, some of the communication variables in the
final models may be emphasized by job-site management more than the others,
depending on their relative contributions to the variation of worker
satisfaction. SATISFY had a range from 2 to 14 (Table 2), where 2 indicated that
the worker was very satisfied and 14 indicated that he/she was very unsatisfied.
The value of the right-hand side of equations (3) and (5) should be kept very
close to 2 in order to achieve high worker satisfaction. Similarly, lower values
for
communication
pattern variables signify better responses to these variables and vice versa.
Therefore, quantitative variables with higher coefficients (e.g. OPENNESS)
should be more emphasized than variables with lower coefficients (e.g.
REACTION). Also, variable with negative coefficient, such as information
OVERLOAD, should be reduced in order to increase worker satisfaction. As
measured in this survey, the worker should not receive more information at work
than he/she can effectively use, nor less information than required for
performing his/her work effectively.
CONCLUSIONS
Communication Pattern is Related to Worker Satisfaction
From
the above analysis and based on final models (3) & (5) obtained, it can be
concluded that worker satisfaction is related to interpersonal communication.
That is, the satisfaction of construction workers may be increased by
maintaining effective communication pattern at the job-site. A discussion of the
application and practical significance of the results follows.
Subjects and Situations
Most
of the craftsmen that participated in the survey were union members. Majority of
subjects belong to eight construction trades, which included carpenters, pipe
fitters/plumbers, laborers, ironworkers, sheet metal workers, operating
engineers, insulators, and teamsters. These craftsmen were involved in the
construction of a building or highway (roads and bridges) project. Hence, the
results presented in this study are applicable to the above subjects and
situations.
Barriers
The
supervisors on the job-site should eliminate communication barriers between the
workers and themselves. The following six barriers have been deduced from the
data obtained in this work: 1) showing unconcern or indifference; 2) noise or
distraction; 3) hidden agenda or messages; 4) lack of clarity; 5) poor listening
habits; and 6) not giving proper feedback [Imundo, 4].Workers who reported a
high frequency of occurrence of these barriers on the job-site, were less
satisfied with interpersonal communication. Therefore, the supervisors should
show interest in the activities of the workers and react frequently to them. At
the same time, supervisors should reduce unnecessary noise or distraction at the
job-site and provide the workers with the necessary agenda and messages. Daily
agenda and messages could be provided in a morning meeting or posted in a place
that is accessible to the workers each morning.
Important communication factors
Three
communication variables (OPENNESS, ACCURACY, FEEDBACK) were found to be
significantly related to the other variables used in this research. These
variables also contributed significantly in the relational model developed for
worker satisfaction. Hence, they may be considered as the most important
communication factors at the construction job-site.
OPENNESS
can be improved by creating ways that will make it easy for the worker to
communicate their feelings and ideas about their job condition with immediate
superiors. This could be done by having occasional group/individual meetings.
Supervisors should also make themselves easily available to the workers, without
intimidating them.
ACCURACY
may be ensured by providing the worker with specific instruction and information
that he/she needs at work in a timely manner, so that the worker would know
exactly what he/she is expected to do at work. Subsequently, there would be less
rework at the job-site due to incorrect instruction or information received.
Supervisors at construction job-sites should be very receptive towards workers'
FEEDBACK. This could be achieved by soliciting reactions or suggestions from
workers through personal questioning or providing collection boxes for
suggestions, and providing rewards for tangible ideas or suggestions.
Supervisors
should respond to each and every suggestion from the workers in other to
maintain their interest. Also, workers should be given ample opportunities to
participate in decision-making about work methods, safety, choice of the type of
work and choice of crew members, either collectively through their unions or
individually.
Satisfaction-Communication Models
Relational
models developed in this study were statistically significant at the 0.05 level,
even when the number of communication variables was reduced to only those that
significantly influence the variation of the dependent variable. Job-site
management should emphasize more on the communication indicators that appeared
in the final models (3) & (5), since these indicators were found to be
significantly related to satisfaction of the workers. These indicators were Mode
of job assignment, Accuracy of information, Reaction of supervisors to
performance, Feedback from workers, Openness of supervisors, Distortion and
Overload (Underload) of information that is received by the workers. However,
this does not mean that other communication indicators should not be emphasized
at the construction job-site. Other indicators may become significant if more
data is obtained and analyzed separately.
LIMITATIONS
This
study was limited geographically to workers in the state of Missouri.
Construction practices vary in different areas of the United States, and also
there are variations in the behavioral and environmental aspects. Thus, the
findings may not necessarily apply to all areas of the country.
Other
limitations include: 1) Data used for the analysis was
collected with a worker questionnaire, which was designed to be
self-administered and self-returned by the subjects. Interviews of the subjects
would be more appropriate for a behavioral research like this study; 2) Majority
of the respondents were union members. Therefore, it may be incorrect to
generalize the results to non-union construction workers; 3) Certain types of
crafts participated. About 19 categories of crafts exist in the construction
industry, but only eight crafts were actively represented in this study. As
such, it may be inappropriate to extend these findings to the other crafts that
did not participate in this research.
ACKNOWLEDGEMENTS
The
author wishes to thank the construction workers, the companies, and the
engineers of Missouri State Highway and Transportation Department for their
cooperation in the acquisition of data for this research. Also, financial
support from Exxon Research Grant for un-sponsored graduate research at
Department of Civil Engineering, University of Missouri-Columbia, is gratefully
acknowledged and appreciated.
REFERENCE
2.
Clampitt, P. G. Communication and Productivity. Thesis
presented to University of Kansas in partial fulfillment of the
requirements for the degree ofDoctor of Philosophy. Lawrence, Kansas,
1983.
|
APPENDIX I. WORKER
QUESTIONNAIRE ITEMS
|
TRADE
UNION
CREW
SIZE
CRAFT
EXPERIENCE
FOREMAN
DURATION
CREW
DURATION
AGE
SEX
Response: (1) Very often (2)_ (3)_ (4)_(5) Never ASSIGNMENT
REACTION
FEEDBACK
DIRECTIONALITY
OVERLOAD
DISTORTION
OPENNESS Response: Very free and open (2)_(3)_(4)_(5)
Not free and often
SATISFACTION Response: (1)Very Satisfied (2)_(3)_(4)_(5)_(6)
(7)Veiy Unsatisfied
|