(pressing HOME will start a new search)
![]()
![]()
- ASC Proceedings of the 24th Annual Conference
- California Polytechnic State University - San Luis Obispo, California
- April 1988 pp 20-24
|
(pressing HOME will start a new search)
|
|
LEARNING CURVE APPLICATION IN FORMWORK CONSTRUCTION
|
Ali
Touran |
Alvin
F. Burkhart Greeley,
Colorado |
Ziad S.
Qabbani |
|
The
theory of learning curves is briefly described and applied to a
construction project. Formwork labor is a major cost item in any
cast-in-place concrete job and can account for as much as 30% of the
total concrete cost depending on the type of structure. In this paper,
the effect of repetition on the cost and productivity of formwork
construction for spandrel beams and elevator core walls of a 20-story
high-rise building is investigated. Using a straight-line learning curve
model, it was possible to quantify the increase in productivity
resulting from work repetition. Knowing the effect of repetition on
productivity can help an estimator produce a more accurate bid and
therefore improve the chances of winning a contract. KEYWORDS:
Productivity, Learning curves, Concrete formwork, Repetition,
spandrel beams, Core walls |
.
INIRODUCTION
Out
of each dollar spent on cast in place concrete, formwork is a major portion,
ranging from 35% to 60% of the total concrete cost depending on the type of
structure. Formwork costs are made up of labor, equipment and material. Of
these, formwork labor is the most important and can contribute up to 50% to the
total formwork cost. This means that formwork labor can be as much as 30% of the
total concrete cost, and can easily impact the profit or loss of a project.
Research
and experience have shown that repetition can improve labor productivity.
Contractors and designers can reduce formwork labor costs by creating repetition
on the job [2,3,6]. This repetition increases productivity and contractibility,
hence increasing the contractor's profit and saving the owner money. The more
the number of repetitions, the higher the average productivity rate.
Learning
curve theory can be used to investigate the effect of job repetition on the
production rates. In this research, a straight-line learning curve model is
utilized to quantify formwork productivity improvement. At first, the theory of
learning curves is briefly presented and the straight line model introduced.
Then the construction project used in this case-study is described. The
developed learning curves are discussed and the impact of repetition on labor
productivity is quantified. Quantifying the effect of repetition can help
estimators to prepare more accurate bids for future projects.
LEARNING CURVES
The
time required to complete a certain activity several times decreases as the
number of repetitions increases. For example, if a carpenter takes 2 hours to
install the first window in a house, he might install the second window in 1.75
hours and so on. Thomas et al [8] mention several reasons for this improvement
in productivity. The most important ones are: increased worker familiarization,
better crew and equipment coordination, improved organization, and development
of more efficient work methods and material supply systems. According to the
theory of learning curves, whenever the number of products doubles, the average
man-hours or cost per product will decline by a certain percentage of the
previous average rate. This percentage is called the learning rate, and
establishes the slope of learning curve. The lower the learning rate, the higher
the amount of productivity improvement.
Straight-Line Learning Curve Model
Several
mathematical models have been developed to show the variation of productivity
rates (or cost) with the number of units produced. Straight-line, linear
piecewise, exponential and cubic models are examples of learning curve models.
The straightşline model is most widely used in construction [1,4,5]. In the
straight-line model, the learning rate is constant. When this curve is
plotted on a log-log scale, it transforms to a straight line. The model is
expressed as follows [8]:
Y
= Ax ľn
(1)
where
Y = cumulative average man-hours (cost) per unit of product, A = man-hours
(cost) required for the first unit, x = the sequence number and n = slope of the
logarithmic transformation of the learning curve. The learning rate is as
follows
[8]:
S
= 2-n
(2)
For
a given job, n is constant and so the learning rate is constant as well.
The expected range of learning rate for construction operations falls between
70% and 90% [5].
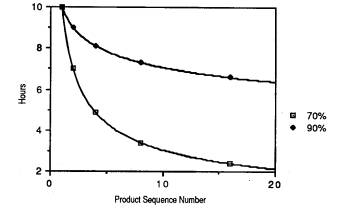
Figure
1 shows a 70% and a 90% learning curve. It shows that if a hypothetical product
follows the 70% learning curve and if constructing the first unit takes
10 hours, then it will take 10 x 70% = 7 hrs/unit on average to construct the
first two units and it will take 7 x 70% = 4.9 hrs/unit on average to construct
the first four units and so on. It is apparent that the productivity gains due
to learning decrease as the number of built items increases. In other
words, a stabilization in the production rate is achieved after complete
familiarization with the job. Still it should be noted that the learning rate
remains constant during the whole process. As the logarithmic version of this
learning curve model is a straightşline, it is easier to compare curves with
each other. The straight-line model is used in this study to quantify the effect
of repetition on formwork productivity.
|
|
|
Figure
1: Typical 70% and
90% Straight-line Learning Curves |
PROJECT DESCRIPPION
The
project studied was King County Correctional Facility located in Seattle,
Washington. This correctional facility is the largest of its kind on the west
coast and consists of 600,000 square feet. The building was designed as four
interrelated, tiered towers with a ductile reinforced concrete frame. The west
tower or wing is 8 stories high; the south wing is 16 stories; the east wing is
18 and the north wing is 20 stories high. The project
contains
3,000 tons of reinforcing steel and 23,000 cubic yards of concrete. The
architect was NBBT and the contractor was Hensel-Phelps [6,7]. The project was
completed in 1985.
Spandrel Beams
The
writers studied the formwork for spandrel beams of this building. The objective
was to investigate the effect of variations of the spandrel beam cross-sections
on the project cost. Spandrel beams were the most variable structural component
in this project. There were 59 different sizes and shapes of spandrel beams in
this project. For example, there were 13 different spandrel beams' crossşsections
in the 7th floor [2,6]. But in floors 9 through 18, the design repeated itself, requiring
only five or six types of spandrel beams. On these floors, labor
productivity (sq. ft/man-hour) rose by 25% compared to the average productivity
for forming all spandrel beams in the building.
As
part of the study on spandrel beams a learning curve analysis was performed on
formwork productivity. Since beams in the project varied drastically from floor
1 to 8, it was decided to exclude them from learning curve analysis. Therefore
the learning curves were constructed for the formwork productivity for spandrel
beams from floor 9 to 18. On these floors the formwork activities were
continuous, the formwork crew did not change and formwork configurations were
reasonably similar. Two types of learning curves were developed in this process.
One type of curve was based on unit data and the other one on cumulative average
data. In preparing unit data, the productivity rate at each floor was plotted
against the floor number. In the cumulative average curve, the cumulative
average productivity rate up to each floor was computed and plotted against the
floor number. The cumulative average approach tends to smooth out the data and
generally makes the data appear better by reducing the amount of variation as
compared to the unit data [8]. Thomas et al [ 8 ] suggest that the unit data
curve be used for controlling current operations, and detecting short-term
changes. The cumulative average curve, on the other hand, can be used for
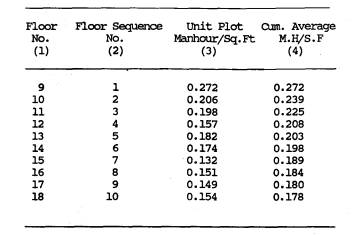
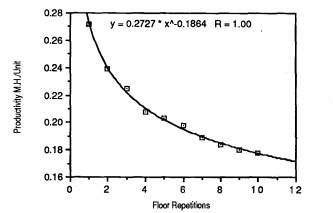
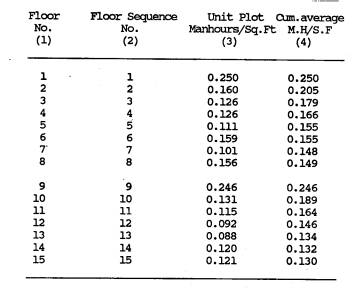
estimating purposes. Table 1 shows the data used in plotting learning curves for
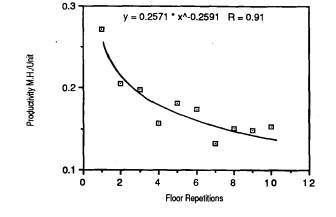
spandrel beams. Columns (2) and (3) were used in plotting Figs 2 and 4 (unit
data) and columns (2) and (4) were used in plotting Figs. 3 and 5 (cumulative
average data).
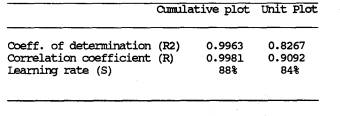
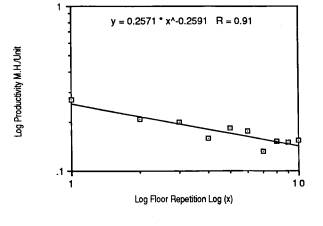
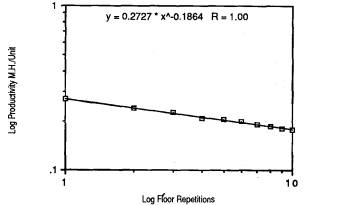
Curves
were fit to the plotted data using the method of least squares. Figures 4
and 5 are logarithmic curves and hence are straight lines because straight-line
models were used. The coefficient of determination (R2), correlation
coefficient (R) and learning rate (S) were computed for this data set (Table 2).
Large values of the coefficient of determination indicate that the independent
variable explains most of the variance associated with dependent variable. In
this case, the large R2 shows that the straight line model is an
appropriate model for the data. Also note that the learning rate for this job
(i.e. 88% cuimnulative, 84% unit) falls in the range of learning rate expected
for construction operations (70% to 90%) [5].
|
Table
1. Spandrel
beam data for learning curves. |
|
|
|
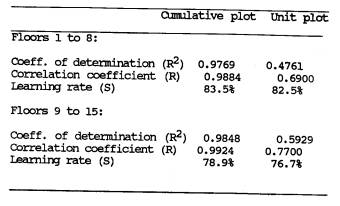
Table
2. Spandrel
beam correlation analysis. |
|
|
|
|
|
Figure
2: LEARNING CURVE (unit data--Spandrel Beams) |
|
|
|
Figure
3: LEARNING CURVE (Cumulative Average--Spandrel Beams) |
|
|
|
Figure
4: LEARNING CURVE (Unit log plot--Spandrel Beams) |
|
|
|
Figure
5: LEARNING CURVE (Cumulative log plot--Spandrel Beams) |
Elevator Core Walls
Learning
curve analysis was also conducted on the formwork for the elevator core walls
of the building [6]. Elevator core walls
were chosen because they were continuous, repetitious and performed by the
same crew. There was a major change in
the core wall configuration in floor 9
which resulted in a different plan
view. For this reason, the core wall was constructed
in two stages. The first stage was from floor 1 to 8 and the second stage
consisted of constructing the core walls in
floors 9 to 15. Discontinuity or change of work scope has a profound effect on
the learning curve. This point is proven in this case because after the data was
plotted it became apparent that fitting one curve to all data (floors 1 through
18) would result in a very low coefficient of determination. Therefore two
learning curves were fit to the data using Table 3.
|
Table
3. Core wall data for learning curves. |
|
|
|
Table
4. Core wall correlation analysis. |
|
|
|
|
|
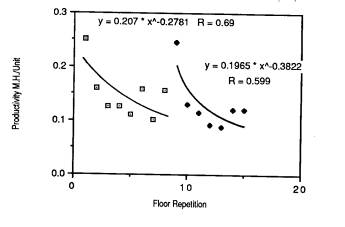
Figure
6: LEARNING CURVE (core walls unit plot) |
|
|
|
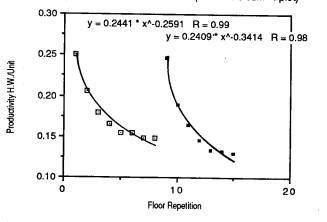
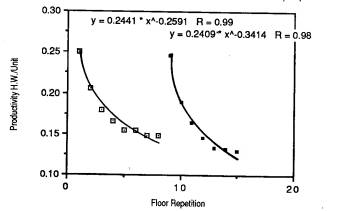
Figure
7: LEARNING CURVE (core walls cur n. plot) |
columns
(2) and (3) of Table 3 were used in plotting Figure 6 which
shows the best curves fitted to the data using least squares. This is a
classical configuration of a learning curve for discontinuous or
interrupted activities. Columns (2) and (4) of Table 3 were used to plot Figure
7 which shows the learning
curves for the cummalative average data. Values of R2, R and S were
computed and presented in Table 4. R2 is rather low for unit data,
especially for floors 1 to 8. One reason for this can be that the straight-line
model is not the best model to use in this case. Another reason for the low R2
is the few number of data points. Note that the learning rate, S, is still
within the 70% and 90% limits. Also note that the values of R and R2
are very high for the cumulative average data. This could be expected also
because by averaging the data, the variations of the single data points were
eliminated.
|
|
|
Figure
7 Learning Curve (core walls cum
plot) |
CONCLUSION
Productivity
gains due to work repetition was quantified using a straight-line learning curve
model. The developed equations can be used as a forecasting tool in similiar
projects. More data is needed for developing reliable forecasting systems, while
the methodology would be similar. Referring to the data presented in Table 1, it
is seen that an average productivity of 0.178 manhours/square foot was realized
on spandrel beam formwork in floors 9 to 18. This is 33% "better" than
the productivity rate achieved on floor 9 (i.e. .272 manhours/square foot).
Estimators should take the effect of learning curves into consideration to
prepare more accurate bids.
The
choice of the most appropriate learning curve model is very important. Low value
of R2 in the core wall analysis suggests that the straight-line model
might not have been the best model to be used in that case. Also, changing the
plan view and intern.ption in the construction process affected the learning
curve drastically. So the learning curve analysis would be more valid in cases
where there are rather a large number of repetitions and the products are alike.
Also, the high value of R2 in core walls when working with cumulative
average data reveals the power of cumulative average data in soothing out the
variations. So this type of data should be used with care and preferrably as a
complement to unit data analysis. In the case of core walls, the average
productivity rate in formwork construction in floors 1 to 8 improved by 40%
compared to the first floor and in floors 9 to 15 improved by 47% compared to
floor 9 (Table 2). Also note that in almost all the developed learning
curves, the productivity rates dropped in the last few cycles. Authors'
experience shows that in most construction jobs this happens due to the time
allocated to finishing and cleaning small items of work that might have remained
from earlier cycles. These times are usually reflected in the productivity
reports of the last few days or weeks.
ACKNOWLEDGEMENT
|
This
study was part of a larger project supported by Hensel-Phelps
construction company. This support is gratefully acknowledged. |
REFER NOTES
|