- ASC Proceedings of the 42nd Annual Conference
- Colorado State University Fort Collins, Colorado
- April 20 - 22, 2006
|
|
|
Comparison of The Risk Minimization Ability of Best Value With That of Low Bid Procurement
|
Kenneth Sullivan, PhD Facility Management Research Center (FMRI), Arizona State University, PO Box 870204, Tempe, AZ 85287-0204, USA
|
Matti Krus, PhD Candidate, M.SC Indepro Construction Management Consultants Ltd, Lapinlahdenkatu 21 C, 00180 Helsinki, Finland |
|
Dean Kashiwagi, PhD, PE Performance Based Studies Research Group (PBSRG), Arizona State University, POBox 870204, Tempe, AZ 85287-0204, USA
|
Charles Egbu, PhD School of the Built and Natural Environment, Glasgow Caledonian University, 70 Cowcaddens Road, Glasgow, UK GA OBA
|
|
To achieve owner satisfaction, projects must be completed on time, within budget, while meeting or exceeding owner expectations. A delivery system with the ability to minimize risk can result in consistent owner satisfaction. A delivery system in a best value, or performance-based environment has a greater ability to minimize risk than a delivery system in a price based, or low bid environment. The differences between the performance based and the price-based environment are provided in this paper Along with a statistical comparison between the results of a specific best value procurement system (The Performance Information Procurement System (PIPS)ãä) and the low bid, a price based delivery system in the USA. A survey was conducted to collect data from owners who had implemented PIPSãä as well as low bid. Results complement the theoretical understanding that risk can be minimized by moving to a performance based environment from a price-based environment.
Key Words: Best value, Customer Satisfaction, Risk Minimization. |
Introduction
The past few decades have brought about many changes in the construction industry as numerous project delivery systems have been proposed. These systems include low-bid, design-bid-build, CM@risk, etc. (Konchar and Sanvido, 1998). Over this time the low bid system has consistently remained the most popular procurement system (Egbu et al, 2004). Despite its popularity and continued use, many users have documented the poor performance and poor quality of contractors that have been procured using the low-bid process (Post, 2001, Angelo, 2001, Hung, 2002). This poor performance has led to dissatisfaction among owners.
In light of this dissatisfaction, many owners’ low bid mentality and lack of education are perceived by the industry to also be problems, as some of the poor performance is thought to be a direct result of owner actions (Post, 2000). Specific to the low bid method, it is thought to have created countless problems in terms of projects not being on-time and within budget simply as a result of inherent parts of its process (Illia, 2001). Alternative project delivery systems, such as construction management-at-risk and various forms of design-build have solved some problems but created others (Post, 2001). Nevertheless, poor performance has remained a problem for construction clients and a problem for the construction industry as a whole.
Low Bid Delivery Environment
Performance is when construction is completed on time, within budget, and meets or exceeds customer expectations. Theoretical research at the Performance Based Studies Research Group (PBSRG) at Arizona State University indicates that a system having a greater ability to minimize risk will lead to better performance for project owners (Kashiwagi, 2004). To understand this concept, consider Figure 1 below.
|
|
|
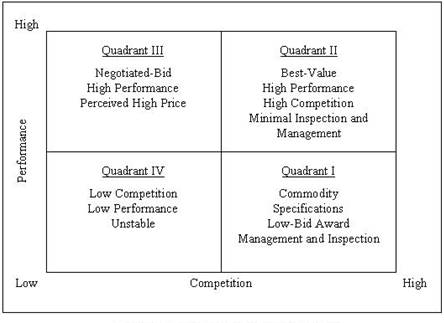
Figure 1: Construction Industry Stability (Kashiwagi, 2004) |
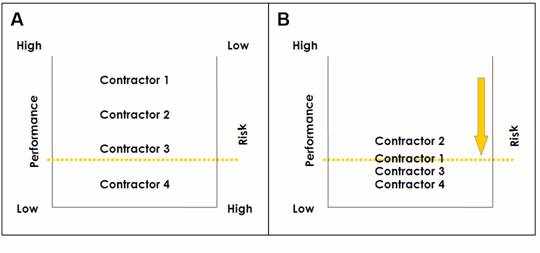
Figure 1 shows the Construction Industry Stability model. Quadrant I is an environment where construction is delivered as a commodity. In other words, this is the quadrant having minimum (or specified) performance requirements. The construction industry has predominately operated in this quadrant via low bid selection, where ability and competence are not competed; only price matters. To minimize risk in this quadrant, the industry has increased the role of the construction management professional. This moves the risk of non-performance to the owner, away from the contractor who, theoretically, should be responsible for performance. Figure 2 shows how a price based award can increase nonperformance risk, thereby forcing owners themselves to minimize the risks.
In Figure 2a there are four contractors with different levels of performance. Contractor 1 has the highest performance and Contractor 4 has the lowest level of performance. Correspondently, Contractor 1 has the lowest risk while Contractor 4 would have the highest risk of nonperformance. Contractor 1, based on their experience, does not need detailed instructions, can preplan due to their knowledge and experience, and minimizes risk before construction instead of during construction.
|
|
|
Figure 2: Maximizing Risk in the Price Based Environment (Kashiwagi, 2004) |
Contractor 1 identifies risks in the project because of their experience. On the other hand, Contractor 4 has very low performance (due to inexperience or resource allocation) and has a difficult time preplanning and minimizing the risk ahead of construction. What happens in construction is that the bid price of Contractor 4 is commonly lower; however, the finished price will be higher than Contractor 1 (due to changes, delays, etc.). In Figure 2b, the client’s representative has identified a minimum level of performance that is required, and will award to the lowest bidder that can meet the minimum level (lowest responsible bidder). In giving this directive, Contractor 1 must perform the following to receive the contract for the project:
1. Look like all the other contractors. Do not differentiate by performance because it will have no bearing.
2. Increase the risk to the owner by just bidding what is directed. Do not use your expertise to identify risk and methods of minimizing the risk.
3. Look to hire the low bidders, meeting minimum requirements, regardless of the performance or the accuracy of their bids.
4. Increase the risk of the client, by not considering potential problems or issues that are not addressed by the plans and specifications.
The client, in giving these instructions, and by using the price based environment, must now find a way to minimize the risk and compensate contractors for the risk. This has resulted in the frequent use of the change order. The professional becomes not only the designer, but also the de facto construction manager. In low bid, the design and construction professionals control Quadrant I and contractors are directed on what, how, and when to construct. They are then managed and inspected.
Best Value Environment
Again referring to Figure 1, Quadrant II is an environment where the owner outsources to a performing contractor to minimize nonperformance risk. The performing contractor makes a profit by minimizing the liability and risk through preplanning, using experienced personnel, and by doing the project just once. The win-win (owner is highly satisfied and receives a project on time, on budget while the contractor maximizes profit) is caused by the efficiency of the delivery system. Profit cannot be maximized in an inefficient environment (Sullivan, 2005). This is the purest form of outsourcing. In outsourcing, the client or customer does not manage, direct, or inspect the contractor (PriceWaterhouse, 2005). Contractors who are unable to compete based on value and minimize risk are forced to a price based environment, where price is the only selection differentiator.
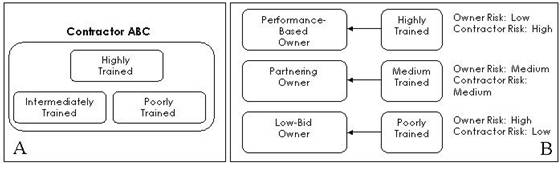
Every contractor has craftspeople with different degrees of training. Some workers are very highly trained, some have been slightly trained, and some workers are very inexperienced or untrained. To understand how contractors hire these skilled workers, examine Figure 3 below. Let us assume that Contractor ABC has three different crews: highly trained crew, medium trained crew, and an inexperienced crew. If three different owners approach the contractor for work, the contractor must decide which crew to send to each owner.
|
|
|
Figure 3: Relationship between process risk and the level of trained craftspeople assigned to the owner (Kashiwagi, 2004) |
In an outsourcing situation, the contractor assumes the risk for construction non-performance. Therefore, the contractor will assign their most skilled craftspeople to this owner in order to minimize their risk. In a “Partnering” environment, the contractor and owner share the risk of construction non-performance. Therefore, the contractor will assign their medium skilled craftspeople. In a “Price-Based” environment, the contractor has very little liability for construction non-performance. Therefore, the contractor assigns their most inexperienced craftspeople to the job, putting the owner at maximum risk.
Competing Performance and Price
A contractor’s past performance record is a key indicator for predicting future performance. The U.S. Federal Government establishes past performance information, along with price/cost, as one of the two mandatory evaluation factors in any source selection over a set dollar threshold (Steyaert, 1997). It is the policy of the Federal Government that agencies use performance-based contracting methods to the maximum extent practicable when acquiring services (Seven Steps, 2002). The best value Performance Information Procurement System (PIPS)ãä is one of the latest among best value construction procurement systems.
PIPS was developed essentially to address the structure of the delivery process of Quadrant I along with the problems of non-performance. As the name indicates, PIPSãä uses performance information to evaluate the participating contractors. Rather than procuring construction subjectively or based solely on price, PIPSãä lends objectivity by adopting a risk minimization approach using past performance information, the contractor’s ability to preplan and minimize risk before construction, and the experience level of their project manger and site superintendent, along with price, in the selection of a winning contractor. A best value process is cost constrained by its structure (clients give their budgets, and they cannot pay more than their budget); therefore, performance is the predominate differentiator. (Prior work provides a detailed explanation of PIPSãä (Kashiwagi, 2004).)
PIPS has been utilized for twelve years in over 400 tests involving nearly $300M of construction. Current users include Harvard University, the US Army Medical Command, Arizona’s City of Peoria, and the Holy Family Medical Center. The process has resulted in 98% customer satisfaction, 98% on-time delivery, and a 50% reduction of construction management. PIPS differs from other best value processes due to its ability to compete performance levels. It uses no performance standards or requirement other than the intent of the owner or client. The process competes and identifies the best value, which before the process is run, cannot be identified. Stated differently, the specifier cannot identify the best value, because they do not know what the best value is. The best value process must therefore compete and identify the best value. PIPS differs from the traditional best value processes due to the following:
1. Forces contractors to identify and produce past performance from past clients and compete based on the ratings, which are not translated into a subjective number.
2. Forces contractors to identify risks along with methods of risk minimization, as well as a preplan as a part of the competitive award.
3. Forces competing contractors to regulate the winning contractor by identifying risks that need to be minimized to be within budget, time, and client expectations.
4. Forces the best value contractor to minimize the risk of construction through a quality control plan that complements the specification and that becomes a part of the contract before being awarded the project.
5. Places the burden of differentiation and proving value on the competing contractors.
6. Minimizes the decision making and requirement of expertise of the client’s representatives.
Hypothesis
The hypothesis of the paper is that when a Quadrant II Best Value environment is used, there will be strong positive correlation between the minimization of the client’s decision making, client satisfaction, and the minimization of risk by the contractor. In other words, a procurement system that minimizes the decision making, managing, and directing of the client’s representative, will minimize the risk of construction (not on time, not on budget, and not meeting the client’s expectations.) This hypothesis is based on the test results of PIPS when compared with the performance of the price based delivery of construction. To further investigate, the hypothesis was tested using simple statistical testing methods. The data was collected through the surveying of facility owners who had actually implemented both the low bid, a Quadrant I process, and the Performance Information Procurement System (PIPS)ãä, a Quadrant II process.
Methodology
The correlation between the risk minimization ability of a best value process and the management, decision making and owner satisfaction with a construction procurement process was determined. The hypothesis that a Quadrant II process (best value) has a greater ability to minimize risk than a Quadrant I process (low bid) was tested using the general procedure for hypothesis testing (Montgomery, Runger, and Hubele, 2004), shown in Table 1 below.
Table 1
General procedure for hypothesis testing
|
General procedure for hypothesis testing |
|
|
|
§ From the problem context, identify the parameter of interest. |
|
|
§ State the null hypothesis, H0 |
|
|
§ Specify an appropriate alternative hypothesis, H1 |
|
|
§ Choose a significance level a |
|
|
§ State an appropriate test statistic |
|
|
§ State the rejection region for the statistic |
|
|
§ Compute any necessary sample quantities, substitute these into the equation for the test statistic, and compute that value. |
|
|
§ Decide whether or not H0 should be rejected and report that in the problem context. |
Survey Description
Data was collected by conducting surveys and collecting feedback from 30 owners who had actually implemented PIPS and the low bid process in the USA. The relevant questions from the survey questionnaire are as shown in Table 2.
Table 2
Relevant criteria from survey questionnaire
|
No. |
Criteria |
Unit |
Low Bid |
PIPSãä |
|
1 |
Rate your overall satisfaction with the process. (10 is very satisfied, 1 is very unsatisfied) |
(1-10) |
|
|
|
2 |
The process minimizes risk (in terms of on-time delivery, no change orders, and meeting expectations) (10 means strongly agree with the statement and 1 means strongly disagree) |
(1-10) |
|
|
|
3 |
The process minimizes the amount of decisions an owner must make. |
(1-10) |
|
|
Analysis and Results
Analysis of Risk Minimization
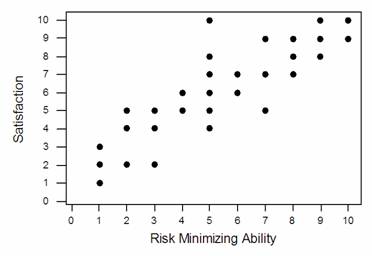
Figure 4 is a plot of owner satisfaction versus the ability of a procurement system to minimize risk.
|
|
|
Figure 4: Owner satisfaction versus risk minimization ability |
Figure 4 is based on the responses received from the owners. It clearly shows a strong positive correlation in the data, indicating that owners’ satisfaction is indeed related to the risk minimization ability of the procurement system. In other words, the higher the risk minimization ability of the process, the higher the satisfaction an owner will have at the end of the project. The correlation was found to be 0.919 (in a range of –1 to +1), which lends credence to the authors’ hypothesis.
The hypothesis testing continued using the procedure mentioned earlier in Table 1. The parameters of interest were:
m1 - Mean of the ability of the PIPSãä process, a quadrant II process to minimize risk, and
m2 - Mean of the ability of the Low Bid process, a quadrant I process to minimize risk.
The test considered if m1 and m2 were statistically different. Also, based on 350 test cases of PIPSãä and theoretical understanding of the process, it was expected that m1 would be greater than m2. Therefore, the hypothesis was then stated as:
· Null hypothesis H0 = m1 - m2 = 0 (Two processes are statistically equal)
· Alternative Hypothesis H1 = m1 - m2 ¹ 0 (Two processes are statistically different, with PIPSãä (a best value process) demonstrating a greater ability to minimize risks than low bid)
There were 30 responses received to the survey of owners who had implemented both PIPS and the low bid on projects in the past. A two sample t-test was performed on a sample size of 30. A significance level a = 0.01 was selected, indicating that the risk of coming to an incorrect conclusion was 1%. The two sample t-test result for the PIPS and the low process are summarized in the table below.
Table 3
Ability of a Process to Minimize Risk
|
Criteria |
Null Hypothesis H0 |
Alternate Hypothesis H1 |
t-value |
P – Value |
Conclusion
|
99% Confidence Interval |
|
Ability of a process to minimize risk |
m1 - m2 = 0 |
m1 - m2 > 0 |
11.56 |
0.0000 |
Since P-value < 0.01, null hypothesis is rejected. |
(4.12, 6.59) |
The results indicate that statistically, based on the responses obtained from 30 owners (sample size 30), PIPSãä has a higher ability to minimize risk than the low bid process. The 99% confidence interval (last column in Table 3) shows that if this analysis is performed 100 times using different samples, then 99 out of 100 times, we would expect the value of m1 - m2 to fall in this interval. Since 0 is not included in this interval, it indicates that 99 out of 100 times, m1 - m2 > 0. Thus, statistically, the two samples demonstrate different risk minimizing abilities, with PIPSãä demonstrating a higher ability to minimize risk than the low bid process.
Analysis of Decision Making
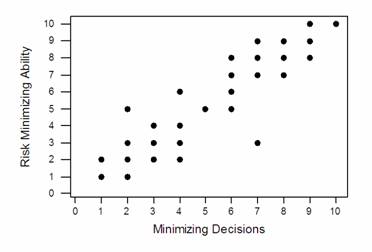
Similarly, a process’s risk minimization and a process’s ability to minimize decision making by the owner were plotted and correlated. Figure 5 is a scatter plot of the survey results for risk minimization and the minimizing of owner decisions.
Figure 5 shows a strong positive correlation in the data, indicating a relationship between risk minimization and the minimizing of owner decision. The correlation in this analysis was found to be 0.909 (in a range of –1 to +1), which lends support to the authors’ assertion that a process that outsources to a contractor (minimizes owner decision) is more efficient in minimizing risk.
Since the data indicated that the minimization of owner decisions is advantageous to the minimization of risk, the research then proceeded to test a best value processes ability to minimize decision with that of the low bid system. The parameters of interest were:
m1 - Mean of the ability of the PIPSãä process to minimize owner decisions and
m2 - Mean of the ability of the Low Bid process to minimize owner decisions.
|
|
|
Figure 5: Risk Minimization Ability and Minimizing Owner Decisions |
As before, the research sought to test whether m1 and m2 were statistically same or different. Also, based on 350 test cases of PIPS and theoretical understanding of the process, again it was expected that m1 would be greater than m2. The hypothesis was therefore stated as:
· Null hypothesis H0 = m1 - m2 = 0 (Two processes are statistically equal)
· Alternative Hypothesis H1 = m1 - m2 > 0 (Two processes are statistically different with PIPS demonstrating higher ability to minimize decisions than low bid)
There were 30 responses received to our survey from owners who had implemented both PIPS and the low bid projects in the past. Two sample t-test was performed on a sample size of 30. The same significance level a = 0.01 was selected and the two sample t-test result for the PIPS and the low process are summarized in the table below.
Table 4.
Ability of a Process to Minimize Owner Decision Making
|
Criteria |
Null Hypothesis H0 |
Alternate Hypothesis H1 |
t-value |
P – Value |
Conclusion
|
99% Confidence Interval |
|
Ability of a process to minimize decisions |
m1 - m2 = 0 |
m1 - m2 > 0 |
9.94 |
0.0000 |
Since P-value < 0.01, null hypothesis is rejected. |
(3.57, 6.19) |
The results indicate that statistically, based on the responses obtained from 30 owners (sample size 30), PIPS has a greater ability to minimize decisions than the low bid process. Thus, statistically, the two samples demonstrate different abilities to minimize decisions and PIPS demonstrates a greater ability to minimize decisions than the low bid process.
Although a sample size of 30 is slightly small, considering the nature of the low bid, the PIPS processes, and the theoretical basis of the PIPS process, it is highly unlikely that a larger sample size would change the conclusions.
Conclusion
Based on the preliminary data (twelve years of testing, $300M of procurement of construction), it can thus be concluded that the best value process PIPSãä, a quadrant II process, has a greater ability to minimize risk for the owner than the Quadrant I low bid award process in the USA. It also shows that the minimized management and decision making requirement of the client has a correlation to the risk minimization. The strong positive correlation between the satisfaction which an owner can experience and the construction procurement process indicates that a construction procurement process that has a higher risk minimizing ability is optimal.
The authors conclude that risk minimization, client management and decision making, and performance of construction (on time, on budget, and meeting client’s expectation) are dependent and related factors. This simplistic conclusion has tremendous value as the concepts of construction management, oversight, client representative decision making, and price based selections and models dominate the current construction industry. Despite the numerous attempts at different processes, the construction industry has remained in the price based Quadrant I over the past decade. The results of this work give strong indications that in order to improve, the construction industry must move in the direction of a quadrant II environment.
References
Angelo, W. (2001, July). How to Curb Bid Abuse. Engineering News Record, 247 [4], 95.
Egbu, C., Kashiwagi, D., Koebergen, H. (2004). Construction Nonperformance is a Process Problem. COBRA, RICS Foundation, London. pg 97
Hung, T.T. (2002, May). Prequalification and Qualified Tendering Group: A Perspective From the Hong Kong Ground Investigation Industry. Cost Engineering, 44 [5], 36-42.
Illia, T. (2001) Late, Overbudget State Job Sparks Contracting Changes. Engineering News Record, 247(1), 17.
Kashiwagi, D.T. (2004) Best Value Procurement: How to use Information System to Minimize Risk, Increase Performance, and Predict Future Success. Performance Based Studies Research Group: ASU.
Konchar, M. and Sanvido, V. (1998, November). Comparison of U.S. Project Delivery Systems. Journal of Construction Engineering and Management, 124[6], 435-444.
Montgomery, D.C., Runger. G.C., Hubele, N.F. (2004) Engineering Statistics, Third Edition. Arizona State University: Tempe.
Post, N.M. (2000). No Stamp of Approval On Building Plans: Contractors sound off over difficulties with bid documents. Engineering News Record, 244(17), 34-37, 39, 42, 45-46.
Post, N.M. (2001, May 14). Bumpier Road to Finish Line. Engineering News Record, 246 [19], 56-63.
PriceWaterhouse, Coopers Global (2005) HR Outsourcing in Government Organizations: Emerging Trends, Early Lessons. Retrieved September 1, 2005, from Http://www.pwcglobal.com/extweb/ newcoatwork.nsf/docid/ 993438BC5D7BD24B85256F030075B.
Seven Steps to Performance-Based Services Acquisition Benchmark Version. (2002). Retrieved January 2002, from OAMWeb, http://oamweb.osec.doc.gov/pbsc/home.html
Steyaert, J. (1997) White Paper Past Performance, U.S. General Services Administration. Retrieved May 16, 2002, from http://www.acqsolinc.com/pastperfdoc/pastperfwp.html