- ASC Proceedings of the 42nd Annual Conference
- Colorado State University Fort Collins, Colorado
- April 20 - 22, 2006
|
|
|
Computer Vision in Construction – Developing an Application to Monitor Steel Erection
|
Kerry T. Slattery, Ph.D., P.E. and Amit Kharbanda Southern Illinois University Edwardsville Edwardsville, Illinois |
|
Computer vision technology can be used to analyze digital photographs of construction sites to provide concise reports on project quality and progress. This information is then available to verify the correct placement of materials, study productivity, and monitor safe practices. Implementation is greatly facilitated by a three-dimensional model of the project so the analysis software knows where to look for each entity. An application is being developed and tested to monitor steel erection in order to demonstrate the feasibility of this approach. Algorithms to calculate the camera location from known points, implement off-the-shelf computer vision software to detect edges, and search for each structural member are discussed. The results of an image analysis of a partially completed structure are presented.
Key Words: computer vision, image processing, web camera, steel construction, construction productivity |
Introduction
Many construction companies install remotely controlled web cameras on job sites. They may be required by the owner’s contract, but construction companies also use cameras to be able to observe activities at any time and market their services through company websites. Cameras can be programmed to automatically save images to create a record of project progress. While a photographic record of the construction may be useful in some situations, extensive effort is required to find relevant photographs and analyze the images to create technical data about the project. If, however, a camera can be programmed to scan critical areas of the project at prescribed times and a computer can analyze the images to identify the state of the project, a concise report can be generated and easily analyzed.
Construction applications of a related technology, laser radar (LADAR), are being studied by the National Institute of Standards and Technology (NIST, Stone and Juberts, 2002). A LADAR device generates a three-dimensional surface point map of the current state of any site. This equipment is more costly than cameras, but a photograph is only two-dimensional. Sufficient information can be derived from a 2-D image for many applications or a second camera can be used to verify the third dimension. Both technologies require a clear line of sight to the objects being observed.
While computer vision technology has been successfully applied in a wide variety of applications such as industrial inspection, biometrics and traffic analysis, it would be difficult to accurately identify components of the constructed project by simply scanning a photograph. The feasibility of computer vision in construction applications is greatly improved when the expected location of the components is provided in a three-dimensional computer model. Quality control and productivity measurements will generally require technology to determine when an object was placed and that it was placed in the correct location. Given the camera position and orientation, the expected location in the picture frame of edges of components, such as structural steel members or reinforcing bars, can be calculated. Simple algorithms are then used to determine whether or not these coincide with edges detected by image analysis software in the photograph. An automatically-generated report summarizing the analysis results may also be linked to the individual photographs for a more detailed review or verification, if required.
Steel erection monitoring was selected as a pilot application to develop this technology and demonstrate its feasibility. Many members in a steel frame can be seen from one camera location, and, with the advent of the CIS/2 data format, three-dimensional computer models of steel frames are frequently available or they can be easily created (Hamburg and Holland, 1999, Fowler, 2003). The first stage of the development, which is described in this paper, is to analyze a single photograph of a partially-completed steel structure. The goal was to determine which members were in place when the photograph was taken. A single digital picture was taken of the project. The camera location and orientation were calculated from the location of known points in the picture. The image was then processed to create a black and white picture with points on edges represented by black pixels. Finally, the expected locations of the two extreme edges of each member were calculated and compared with the location of detected edges. Preliminary criteria were developed to determine whether or not the member was in place. The results indicate that this approach is feasible.
Method
Camera Position Calculation
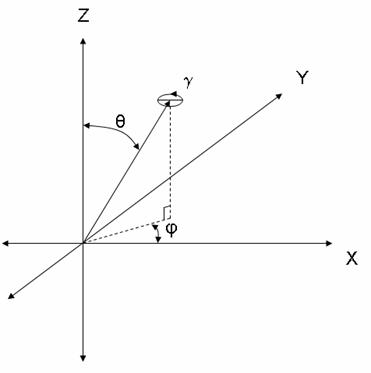
The first step in the analysis is to calculate the position of the camera and its orientation. The position is defined by the X, Y and Z coordinates of the point at which rays traced from the physical objects would be considered to converge. The origin and orientation of this coordinate system should be aligned with the structure for simplicity. The orientation of the camera must also be determined relative to the coordinate axes. In this example the X and Y axes are horizontal and aligned with the column lines. The Z axis is in the vertical direction. The orientation angle φ is in the X-Y plane relative to the X axis. The angle θ is relative to the positive Z axis, and γ is the roll angle of the camera (see Figure 1). A seventh parameter, P, must also be determined to convert one pixel in the image to an angle relative to the center of the image, that is, the axis of the camera. Two assumptions were tested: that one pixel is a constant angle and that one pixel is a constant distance on a plane perpendicular to the camera axis. The difference is trivial for small angles because θ ~ tan θ. In this case the latter assumption provided slightly better results.
|
|
|
Figure 1. Coordinate system and camera orientation parameters |
As it would be difficult to align the camera along a predetermined axis or to survey the actual position and orientation, an approach was developed to approximate the orientation parameters by identifying known points in the camera image, determining the pixel location of these points and then calculating the values of the seven parameters that minimize the error between the actual pixel location and the calculated pixel location. As the resolution and accuracy of digital photographs introduces error, only an approximate location is possible which is improved with the inclusion of more known points. The known points should be distributed around all regions of the picture to provide the best result.
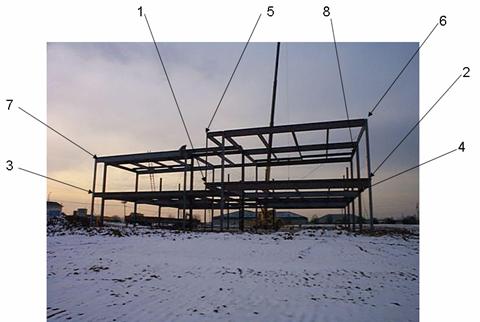
The approach was implemented using the Solver utility in Microsoft Excel to find the parameters that minimize the error. The eight points selected from the photograph are shown in Figure 2. Table 1 gives the X, Y and Z coordinates of these points and the actual pixel locations in the picture relative to the center of the image. A function is developed to calculate the expected pixel location of each point given values for the seven parameters: X0, Y0, Z0, φ, θ, γ, and P. Formulas in Excel use the cell locations for these parameters. The best values will be determined by the Solver function.
1) Calculate the location (Δxi, Δyi, Δzi) of each known point relative to the camera origin.
![]()
2) Calculate the distance from the points to the camera origin.
![]()
3) Calculate the angles φ and θ about the camera origin relative to the global axis system.

4) Transform the X, Y and Z coordinates of the known points into the camera coordinate system given values of φ, θ, and γ. In this coordinate system X’ is the distance from the camera origin to the point, Y’ is used to determine the X pixel location and Z’ determines the Y pixel location.

5) The calculated pixel location is determined from the transformed coordinate and the value of the parameter P which is defined in pixels per radian for small angles.
![]()
6) The error is calculated as the distance, in pixels, from the calculated location of each known point and the measured location of each known point in the picture.
![]()
7) The Solver function is set to minimize the sum of the squared error for each known point by varying the values of the seven parameters.
|
|
|
Figure 2. Location of known points used to locate the camera.
|
Table 1.
Known point coordinates
|
Point No. |
X |
Y |
Z |
|
|
|
1 |
54.8 |
-24.1 |
113.5 |
-49 |
0 |
|
2 |
99.6 |
-24.4 |
113.5 |
231 |
8 |
|
3 |
0.4 |
-5.7 |
113.5 |
-239 |
-17 |
|
4 |
99.6 |
-0.4 |
113.5 |
214 |
-13 |
|
5 |
54.8 |
-24.1 |
129.1 |
-46 |
86 |
|
6 |
100.4 |
-24.4 |
130.1 |
230 |
110 |
|
7 |
-0.4 |
-6.5 |
128.0 |
-237 |
42 |
|
8 |
99.6 |
23.6 |
130.1 |
200 |
44 |
Table 2 gives the values calculated for the camera location/orientation parameters. The error varied between 0.5 and 2.5 pixels for the eight known points.
Table 2.
Camera orientation parameters
|
Parameter |
Value |
|
X0 |
88.3 ft. |
|
Y0 |
-111.1 ft. |
|
Z0 |
99.9 ft. |
|
φ |
105.0° |
|
θ |
81.5° |
|
γ |
1.0° |
|
P |
539 |
Edge detection
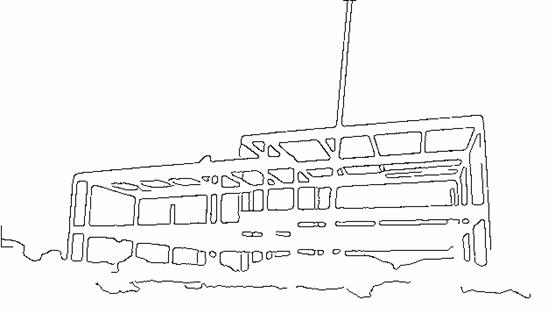
The Computer Vision and Image Processing (CVIP) tools developed at SIUE and available in the public domain were used to analyze pictures of actual steel structures. CVIPtools software consists of about 200 algorithms and functions to develop computer vision and image processing applications (Umbaugh, 2005). The CVIPtools dynamic link library was incorporated in a Microsoft Visual Basic 6.0 program to develop this application. A color bitmap of the picture is initially processed through a smoothing filter (Gaussian blur filter) to mitigate noise effects. The Principal Components Transform/Median (PCT/Median) segmentation algorithm was then applied to the resultant image to find meaningful parts of the image and features of interest. The image was then converted to a gray scale, and edge detection was performed using a Canny filter. An option for Histogram stretch is also available to improve the contrast of the image, if necessary. Each image processing operation requires the user to find values for one or more parameters to effectively analyze each picture. Edge detection results are plotted in a black and white image with edges shown as black pixels as shown in Figure 3 (Slattery and Kharbanda, 2005).
|
|
|
Figure 3. Edges detected in image. |
Member validation
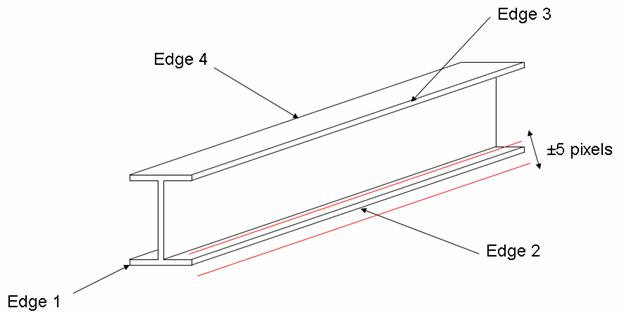
The final step in the image analysis is to look for each steel member in the structure and attempt to determine whether or not it is in place. A steel wide flange section or rectangular hollow steel section (HSS) can be modeled by a hexahedral box enclosing the member. Significant parts of two of the four edges along the length of the member must be clearly visible to identify the member. The end points of the four edges are extracted from the 3D computer model of the structure and transformed into the picture coordinate system using the approach described above. The two extreme edges are then identified. Since some error is expected a series of lines parallel to these edges are analyzed. The lines are shifted from the expected location in one pixel increments up to five pixels on either side. For the beam sketched in Figure 4, Edges 2 and 4 would be analyzed. A total of 11 lines would be scanned for each of the edges. All pixel locations along the two edge lines are calculated and compared to the black pixels in the processed image (see Fig. 3). The number of black pixels lying on each of the two edges, Ea and Eb, is determined for each case and the shift value, S (from -5 to 5), which gives the largest product of these two values is recorded.
|
|
|
Figure 4. Member edges analysis. |
The member verification algorithm is under development and will require an analysis of several structures to complete calibration. Three functions are currently being evaluated and compared with threshold values to make the determination of member placement. The first is simply the number of pixels, S, that the member position was shifted from the expected location to the location that coincided with the greatest product of Ea and Eb. The second criterion is the square root of the product of Ea and Eb divided by the total number of pixels in one line, T, and the third is the difference of these values divided by T. These three criteria were selected to give measures of the likelihood that the actual steel member is present. Threshold values, V1, V2 and V3 were determined that maximized the total number of valid evaluations, that is, minimized the number of false positives and false negatives. The criteria are:

Results
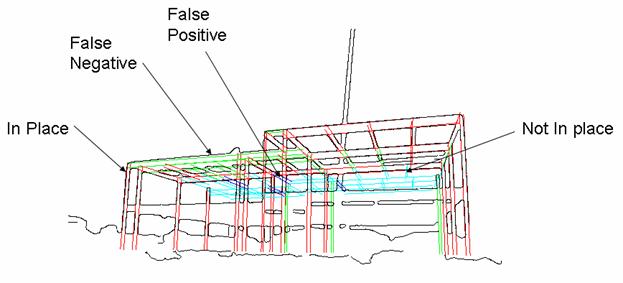
Figure 5 presents the preliminary results of the analysis. Of the 72 members planned for erection in Sequences 1 and 2, 44 were in place while 28 were not. The image analysis made the correct determination in 54 cases or 75% of the time. The identified in-place members are highlighted in red, and those members not in place are in cyan. There were 14 false negative results highlighted in green and 4 false positives in blue. The threshold values were:

|
|
|
Figure 5. Validation results |
Discussion
Computer vision technology can be developed for construction to assist with quality control and progress monitoring. An application has been demonstrated that attempts to identify which members are in place at the time a digital photograph is taken. The camera position is approximated with adequate accuracy using the location of known points in the photograph, and a three-dimensional computer model of the structure is used effectively to simplify the analysis. While further development is required to improve the accuracy, the preliminary results indicate that steel erection monitoring is feasible.
Future research will involve periodic monitoring of a steel structure under construction. A camera will be installed near the structure and programmed to take pictures at defined intervals. Preset pan, tilt and zoom settings can be used to gain higher resolution photographs of all parts of the structure. The camera may have to be moved as the steel erection progresses. Camera placement strategies and detection algorithms will be further developed to improve the accuracy of the results. The output will be a report listing the time each member was placed in the structure. These results can be used to document progress, study productivity and help identify other applications for this technology in construction.
Acknowledgements
Funding for a graduate research assistant was provided by the School of Engineering, Southern Illinois University Edwardsville.
References
Fowler, J. (2003). "Building Better." Modern Steel Construction, AISC, 43(6), 20-23.
Hamburg, S.E. and Holland, M.V. (1999). “Leaping Ahead with EDI.” Modern Steel Construction, AISC, 39(2), 42-48.
Slattery, K.T. and Kharbanda, A. (2005). “Using Web Camera Technology to Monitor Steel Construction.” Proceedings of the 1st International Conference on Construction Engineering and Management, 841-844.
Stone, W.C. and Juberts, M. (2002). “Towards the Ultimate Construction Site Sensor.” International Symposium on Automation and Robotics in Construction, 19th (ISARC) Proceedings. NIST, 393-400.
Umbaugh, S.E. (2005). Computer Imaging: Digital Image Analysis and Processing, Taylor and Francis Group.