-
- Research to Correct the Problems of the Regulators of
Client’s Risk
-
- Kenneth Sullivan, Ph.D, Dean Kashiwagi, Ph.D, P.E., Blake Carroll,
Matthew Lee, and Marie Kashiwagi
- Performance Based Studies Research Group (PBSRG)
- Arizona State University
- Tempe, AZ
-
The bonding and insurance surety industry has had difficulty
regulating risk in the construction industry. They have had a constant
increase in payouts and premiums due to increased construction contractor
nonperformance in the price-based construction environment. This paper
reviews the mechanics of the construction contractor funding model, the
construction surety model, and the construction industry structure. The risk
of the surety industry is attributed to volume and price based practices. It
identifies that the surety industry is caught in the same predicament as the
contractors: They are trying to regulate. The paper proposes changes in the
surety model, and a research proposal to test the hypothesis that sureties
will be successful if they minimize the risk of nonperformance.
-
-
Key Words:
Construction Industry Sureties, Price Based Practices, Construction Risk,
Construction Performance
-
-
-
- Introduction
-
- The construction industry represents 8% of
the U.S. gross domestic product according to the U.S. Census Bureau. The
construction industry employs over 6 million workers in over 1.9 million
construction companies, with revenue of $916 billion (Engineering Technology
2004). With the most competition seen than ever before in recent years and
increased expectations by project owners, the construction industry is one of
the most risky fields of business there is today (SIO 2004). With this risk,
there comes the need for insurance and bonding companies to underwrite and
guarantee the completion of construction projects. Over the past thirty years
the construction industry has moved from a performance-based sector to a
price-based sector. This move has had an enormous impact on the construction
industry. When the focus of the industry was on performance, contractors were
more attentive to the quality of work and reputation. A contractor’s
reputation was more important and based on past performance. If a contractor
did not perform, the chances of future work was slim. The construction
industry clients are concerned primarily with three performance areas: having
the project completed on-time, within the proposed budget with minimized
change orders and meeting the quality expectations of the owner. When the
construction industry moved into the very competitive price-based environment,
contractor motivation shifted from quality to price, making performance an
inconsistent attribute when selecting a contractor in today’s price based
marketplace.
-
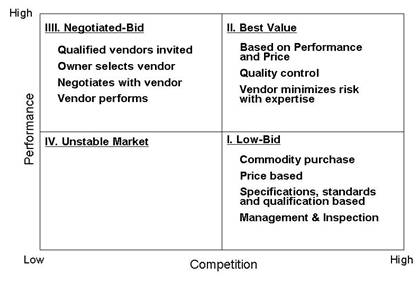
- Figure 1 shows that high performance
contractors are asked to not use their expertise and bid a construction
project with the lowest possible price. Because risk is the reciprocal of
performance, the client’s directive to the contractors is to bid the lowest
possible price and maximize the potential risk. If the contractor is being
asked to maximize risk, the client is giving the competitive advantage to
those contractors who are:
-
-
1.
More likely to pass the risk to the client.
-
2.
Lower performers who cannot predict risk of construction projects.
-
3.
Volume based.
-
4.
Have a lower quality of work.
-
-
|
- Figure 1: Construction
Environment (Kashiwagi 2002)
|
-
-
- Price
Based Environment in the Construction Industry
-
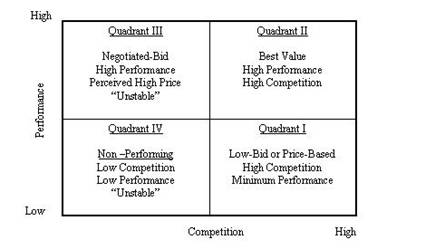
- The construction industry can be simply
explained by the Construction Industry Structure (CIS) model (Figure 2) which
explains the industry based on performance and competition. The three major
segments of the industry are the negotiated bid (high performance, limited
competition), the best value award (high performance and competition), and the
price based sector (high competition, minimal performance). The risk is
highest in the price-based sector (risk is the opposite of performance).
Surety companies maximize their profit when the construction industry is in
the high performance environments.
-
|
- Figure 2: Construction
Industry Structure (Kashiwagi 2002)
|
-
- The construction industry is not in the
performance environment. Rather it is in the price-based sector based on the
following measurements and observations:
-
-
-
-
Construction performance is very inconsistent.
-
-
The craftsperson skill and construction coordination/supervision level
is decreasing.
-
-
Contractor profits are relatively low for a high-risk industry (1-5%).
-
-
Contractor turnover is high, and not limited to new contractors.
-
-
Surety payouts are high.
-
-
Insurance companies participating in construction surety are
consolidating and having a more difficult time surviving.
-
-
Construction bonding and insurance rates are increasing.
-
-
Both contractors and sureties are taking a volume-based approach
instead of risk adverse position.
-
-
The contractor and the client are in an adversarial or “win-lose”
relationship. The client is requesting the contractor for the minimal
performance for the lowest price. The contractor is following the client’s
instruction and maximizing instead of minimizing the client’s risk. The
client tries to minimize that risk by managing and inspecting the contractor
and using performance bonding.
-
-
-
Volume Based Philosophy of the Price Based Environment
-
|
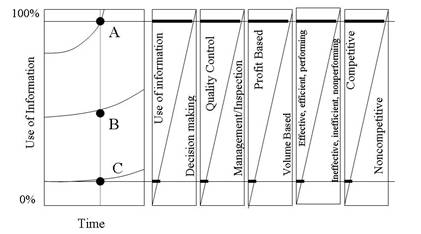
- Figure 3: Rate of Change
and Kashiwagi Solution Models (KSM)
|
-
- Figure 3, the Change Rate Chart and two
way Kashiwagi Solution Models (KSM), shows that the difference between the low
risk (high information party) Type A and the high risk (low information party)
Type C. The two way chart shows the relative difference of the two parties in
relation to the amount of information that is being used. For example in the
first KSM, it shows that the Type A uses a maximum amount of information
(longer line) before the event to minimize risk. The Type C uses very little
information (shorter line). The Type A practices quality control. The Type C
practices very little quality control, and feels much more comfortable being
managed and inspected. The Type A does less work and maximizes profit. The
Type C maximizes the amount of work and minimizes their profit. This is
called commodity work, or price based work. The risk is greater with the Type
C work. Figure 3 then defines the price-based work as:
-
-
Minimizing the use of performance information.
-
Minimizing quality control (that comes with expertise).
-
Maximizing management and inspection (which is required with inexperienced contractors).
-
Volume based work with lower profit margins.
-
Higher risk.
-
- Both the contractor investment/funding
model and the surety model are both volume based (increased risk in a
noncommodity industry). There are two major participants in a construction
contractor: the owner or investor, and the contractor personnel (construction
managers and craftspeople). Construction companies are usually created by the
investor/owner’s investment funding. The funding is used to purchase the
required assets, personnel and services to start the construction company.
The contractor is then allowed to bid projects ten times the size of their
financial worth. In the vernacular of insurance companies, this is defined as
risk.
-
- The surety companies are in business to
make a profit by underwriting contractors who can perform (finish on-time,
on-budget, and meet the requirements of the client). If the contractor cannot
perform due to a lack of personnel who have the appropriate experience,
financial stability, or have maximized their capability on other projects, it
is in the best interest of the sureties to deny the contractor a performance
bond. In this manner, the sureties become the regulator of construction
performance in the industry.
-
- When the contractor makes a 1% profit, the
investors are actually making a 10% increase of their investment. Therefore,
the investors do not mind if the contractor makes a 1% profit of the project
bid. However, if a contractor does not make a profit, the investor’s loss is
exponential. It is therefore in the best interest of the investor for the
contractor to do more work, minimizing the chances of not making a profit. If
the contractor is making only a 1% profit, the contractor’s personnel are put
under extreme stress to ensure that the profit is maintained. At a 1% profit,
any mistakes in scheduling, bidding, unforeseen events, poor coordination, or
construction errors can easily erase the profit. To maintain the profit
margin, the contractor will attempt to increase its volume and pass the risk
to all other parties. The high turnover rate of contractors, the poor
performance record, and inability to increase the quality of work validates
the concept that although investors are satisfied with a low profit margin,
the low profit margin places the contractor personnel at extreme risk.
-
- It is the sureties’ function to regulate
which contractors are not a risk (allowed to do ten times the amount of work
as their assets). It is common practice that the sellers of the performance
bonds for the surety companies are independent sales personnel who are paid
based on commission. They are therefore volume oriented and not risk
adverse. They themselves have no risk. After being paid their commission,
they are no longer involved in the construction. This coupled with the
concept that the sureties do not make their profit on the underwriting but by
investment of the fees in the stock market, also encouraged the sureties to be
volume oriented. These practices have brought risk to the sureties and
insurance companies when the stock market significantly declined. Also, as
the volume oriented construction industry became riskier, payouts increased to
almost 60% of premiums, putting sureties at risk and forcing indiscriminate
higher insurance and bonding rates to the contractors. The volume-based
approach of both the contractors and sureties has done little to stem the
nonperformance in the construction industry (Surety Bonds 2003).
-
- As a result of the volume based approach,
bonding and insurance companies are underwriting contractors based on project
size rather than past performance and the ability of the contractor to
minimize risk. Underwriters still have brokers working to sell based on
volume. Brokers stand between companies that want to purchase insurance and
the companies selling insurance, taking a commission for services rendered.
Not only are these brokers paid on commission, but they also occasionally
receive kickbacks, which is paid only if the broker places a certain amount of
business with a particular insurer. (The Economist Newspaper 2004)
-
-
- Bonding and Insurance Industry Losses
-
- The problem on the contract side of the
surety business started appearing in 2000 when there began to be a large
number of failures by subcontractors that had taken on more work than they
could handle. This produced $600 million in losses for sureties, of which
$400 million was pushed off to re-insurers. After more than a dozen years of
profitability, a recession began in the spring of 2001, which slowed down the
construction industry and sent 255 public companies into bankruptcy, most of
which were users of commercial surety bonds. As contractor failures
increased, sureties paid nearly $1.8 billion in claims in 2000 and 2001
according to The Surety Association of America (SAA). Then the attacks on the
World Trade Center hit insurers for roughly $40 billion (Krizan et al. 2002).
-
- In reaction to severe losses, many
sureties exited the business, some increased rates, and all took a more
disciplined approach with underwriting and capacity. A few surety companies
consolidated or left the market altogether. Sureties became more cautious
about bonding large-scale, long-term contracts. It was no longer a buyer’s
market. The more conservative surety companies continued to do business as
always but with an eye on underwriting and claims (Surety Bonds 2003). Today,
the commercial and contract surety markets are having trouble with capacity
restrictions due to reinsurance. In the past seven years, insurance and
bonding rates have increased. In those seven years, the losses incurred
jumped from 25.6% to 69.8%, a total increase of 52.1% (see Table 1).
-
- Table 1:
- Aggregate Insurance Expense Exhibit Data Calendar
(1998-2002)
|
- Calendar Year
|
- Premiums Written
|
- Premiums Earned
|
- %
|
- Losses Incurred
|
- %
|
- 1998
|
- 2,930,601
|
- 2,824,405
|
- 100
|
- 723,292
|
- 25.6
|
- 1999
|
- 3,399,321
|
- 3,077,088
|
- 100
|
- 902,319
|
- 29.3
|
- 2000
|
- 3,363,352
|
- 3,218,469
|
- 100
|
- 1,491,053
|
- 46.3
|
- 2001
|
- 3,473,090
|
- 3,330,161
|
- 100
|
- 2,748,424
|
- 82.5
|
- 2002
|
- 3,754,733
|
- 3,513,742
|
- 100
|
- 2,454,258
|
- 69.8
|
-
|
-
|
-
|
-
|
-
|
-
|
- TOTAL
|
- 16,921,097
|
- 15,963,865
|
- 100
|
- 8,319,346
|
- 52.1
|
-
-
- More than 80,000 contractors failed during
1990-1997, leaving private and public construction projects with liabilities
exceeding $21.8 billion (Construction Chart Book 2002). Surety was a $3.2
billion industry in 2001 and there were nearly $2.2 billion in gross losses
(State Of The Surety Market 2002). With these dramatic increases in surety
losses, the construction industry’s stability and sustainability is
questionable if it remains in the price-based sector. Underwriting standards
declined consistently from 1992 to 2000 with new carriers fighting for market
share and becoming more aggressive, resulting in poor loss ratios for the
industry (State Of The Surety Market 2002). Bonding and insurance companies
looking for profitability and sustainability must re-evaluate their
operations.
-
-
- Impact on Construction Industry
Sustainability/Profitability
-
- Some insurers have reviewed the losses on
their construction book of business and have decided to stop underwriting
construction risks. Not only do other insurers not want to write new
construction accounts, but they are issuing cancellation notices to
contractors in the primary construction class codes, the majority of them
being General Contractors and Artisan Contractors in trades such as
excavation, concrete, carpentry, drywall, and roofing. Some contractors are
looking away from insurance companies as well. Contractors as well as other
companies are buying less coverage. Policy limits for insurance in all
industries declined 9.4% in 2003 and 14.5% over the past three years,
according to a survey by broker Marsh and
McLennan Cos.,
New York City. Construction insurance costs are near the top for all
industries. For $1 million of coverage it costs on average $20,620 (SIO
2004). Many contractors’ premiums have climbed substantially, more than
doubling in some cases. Even though contractors are paying more than double
for their policies, their umbrella coverage in most cases is half what it used
to be. This is forcing many smaller construction company owners to downsize
by cutting managers pay and making unwanted layoffs.
-
- Ten years ago the top ten sureties had 20%
of the business and today they have 40% (Krizan et al. 2002) As the loss
ratios have increased bonding and insurance companies have had to merge or
leave the surety business completely. Bonding and insurance agencies have had
to limit the coverage with numerous exclusions with hopes to spread the risk (SIO
2004). Contractors now must find numerous insurance policies to cover a
project, which in the past was covered by a single insurance company.
Therefore, construction companies are paying higher premiums for many
insurance policies with less overall coverage.
-
- Contractors on mega projects ($200 million
and up) will experience the greatest change in their bond programs (Surety
Bonds 2003). Not only are the large projects affected, small contractors who
perform well and produce quality products will also be affected.
-
-
- Hypothesis
-
- The authors are proposing that sureties
cannot increase their profitability in the price- based sector. The structure
of the environment is increased risk, a higher cost of overhead in an attempt
to manage and inspect the risk. This includes increased bonding and insurance
costs. Sureties are not profitable in underwriting contractors with high
risk. The paper proposes that sureties can be more profitable in the best
value, high performance environments.
-
-
- Methodology
-
- The methodology would be to identify
contractors who either take the approach of a high performance contractor who
minimizes their workload or is working for a best value client who is
providing an efficient, “win-win” environment for the contractor. The
methodology would include minimizing any high risk or volume based practice
previously used. This includes giving lower rates on volume-based work or
using independent brokers paid on commission.
-
-
- Proposed Research
-
- One of the co-authors is being asked to
present to the National Sureties Meeting for the second year in a row. The
first presentation explaining the risk of the price based construction sector
surprised the majority of attendees (independent sales personnel, sureties,
insurance company personnel). Their reaction confirmed that
sureties/independent sales personnel don’t understand the mechanics or risk of
the construction delivery process. The objective of this year’s presentation
is to propose a research project with a surety/insurance company. The
research effort will be to design the mechanism for the following:
-
-
Identify high performance/low risk contractors who can be
regulated with performance information.
-
Identify contractors who are high performing and working for best value
clients who have use a risk minimization delivery process.
-
Identify how the sureties can minimize their
risk on an ongoing basis by motivating the contractors to continuously
improve.
-
Identify the mechanism that will replace the
independent broker who works on commission.
-
- The proposed research methodology
includes:
-
- Identification of a high performing
contractor or best value based client. Identification will include a
collection and analysis of past performance information, ability to
effectively assess risks on contracts, and project performance in ongoing
operations. The same would hold true for the selection of best value based
clients – the best value system used by the selected clients would have to
show consistent results of procurement through high performing contractors.
Delivered work would have to be consistently on-time, on-budget, no GC
generated cost change orders, and high customer satisfaction.
- Surety Results from Best Value Pool –
once the high performing contractors and best value clients have been
identified the research would move to tracking the results of the sureties
profit from these research pools. The research pool would consist of profit
based contractors that do not operate under volume-based returns. If the
profit results from the high performing research pools showed gains over
normal operations the research would move into the phase of implementing
change.
- Adjustment and Testing of Surety
Practices – once a statistically significant difference in surety
performance has been established between the research pool and normal
operations adjustments and testing of those adjustments to normal operation
would commence. Adjustment could include, though are still in development,
considerations for volume based work, broker payment, tracking of
performance information, etc. The developed mechanism will assist or
replace the broker-on-commission practice.
- Final Analysis of Surety Adjustments –
after a decided duration (2-3 years) the results will be analyzed to
determine if the surety improved and to ensure that the improvement was
caused primarily by the adjustments made and not outside market factors.
-
-
- Conclusion
-
- The regulatory function of the
surety/insurance groups is dysfunctional. The observations and measurements
of the surety company and construction industry show high risk and low
performance. The authors are proposing that increasing rates in the
price-based sector will not stabilize construction industry performance. The
price based delivery process that uses minimum standards, management, control,
and inspection by client’s representatives, which sets an adversarial
relationship and maximizes the opportunity for less experienced contractors,
puts the sureties at risk. It is proposed that the sureties move their
business to the best value environment and use the practice of performance
information and risk minimization to maximize their profit. This proposal
will be further discussed with potential surety research partners.
-
-
- References
-
- Ames, W. (2002) Secrets of a Surety.
The Associated General Contractors (AGC) of America.
-
- Bonding and Insurance Trouble. (2004,
February 26) Engineering News Record (ENR). URL
http://enr.construction.com/opinions/editorials/archives/040126.asp
-
- Construction Chart Book. (2002) The
Construction Chart Book (3rd ed). The U.S. Construction Industry
and Its Workers.
-
- Engineering Technology Curricula & Courses
(2004, September 1) Construction Management.
Western Carolina University: Engineering
Technology. Accessed on October 1,
2004, at http://et.wcu.edu/ET-CC_CM-gen-info.htm.
-
- Grenier, D. (2001) Construction Insurance
in 2001 and Beyond: A Wake-Up Call! C-Risk Inc. Consultants in Risk
Management. URL
www.c-risk.com/Articles/dlg_ins_wake-up_01.htm
-
- Kashiwagi, D. (2002) Best Value
Procurement (2nd ed). Performance-Based Studies Research Group
-
- Korman, R. (2004, January 26) Rising
Prices, Shrinking Policies Generate Waves of Uncertainty. Engineering News
Record (ENR), 252 (4), 22-27.
-
- Korman, R. and Illia T. (2003, August 4)
Insurance: Policies for Defects Axing Key Elements. Engineering News Record (ENR),
251 (5), 12-13.
-
- Krizan W., Korman R., Tulacz G., and
Ichniowski T. (2002, February 11) Bonding Businesses Going For Broke?
Engineering News Record (ENR). URL http://enr.construction.com
-
- Schubert L. (2001, July) Surety Industry
Addresses Increases in Surety Losses. URL
http://www.irmi.com/Expert/Articles/2001/Schubert07.aspx
-
- SIO (2004, November 15) Surety Bonds At
Work. Surety Information Office (SIO). URL
www.sio.org/html/sbw
-
- SIO (2003) “Why Do Contractors Fail?
Surety Bonds Provide Prevention & Protection.” SIO Surety Information Office.
-
- Surety Bonding: The Importance of
Surety Bonds in Construction.
(2003, October 15) MORGAN Insurance. URL
http://www.sio.org/html/importance.html
-
- The Economist Newspaper. (2004, October
21) Just How Rotten?. URL http://www.economist.com
-
- State Of The Surety Market (2002,
December) Accessed on October 31, 2004, from http://www.cybersure.com/documents/surety/surety%20market%20-%202002.pdf.
-
- Surety Bonds 2003 (2003) Accessed on
October 31, 2004, from http://enr.construction.com/resources/special/archives/surety_2003.asp
-