![]()
![]()
- ASC Proceedings of the 40th Annual Conference
- Brigham Young University - Provo, Utah
- April 8 - 10, 2004
|
|
|
Six Sigma Applications in Construction
Construction performance issues have been attempted to solve using a project approach. A project approach is used when the analyzer thinks that the problem of non-performance is being caused by the differences with projects. The authors propose to use a process approach. Contractors in the price-based environment with minimum standards, are motivated to lower performance. In a best value environment, it is in the interest of the contractor as well as the client to raise performance. The preliminary tests have shown an increase of 30% in performance. This paper proposes that the Six Sigma and other continuous improvement processes can be implemented only in best value environments. Six Sigma uses data and statistical analysis to measure and improve a company’s performance. It increases profits by eliminating variability, defects and waste by using the: define, measure, analyze, improve, and control (DMAIC) approach. This methodology has been applied in various domains such as manufacturing, services, finance, and healthcare. If the Six Sigma process is used on the entire construction industry, the process would identify that the construction industry problem is a process issue, validating the hypothesis that the performance problem is a process issue.
Keywords: Six Sigma, Construction Performance, Price Based, Performance Based.
Introduction
The construction industry has taken a project approach in solving its problems. A project approach is used when the analyzer thinks that the problem of non-performance is being caused by the differences with projects. Because the industry has accepted that projects are unique i.e no two projects in construction industry are same, there are no useful relative performance numbers on contractors, project managers, and site superintendents. Using this approach, if all projects are unique, using any project performance numbers to compare the performance of different contractors would be flawed. Without related and relative performance data, the industry must depend on the expertise of experts, consultants, and knowledgeable construction and project managers. It makes it difficult for clients to know what they are getting, and for contractors to continuously improve. This type of industry structure is unstable because it cannot continually provide performing construction and improve the quality of the construction.
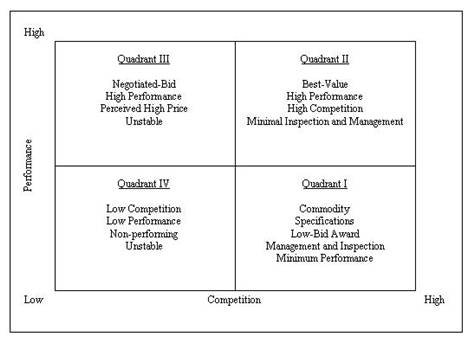
Figure 1: Construction Industry Structure Model
Construction started as a performance based industry (Quadrant III in Figure 1). It was common practice to pre-qualify contractors to those who the owner had a knowledge of, have the contractors bid, and selecting and negotiating with the best value contractor. Price pressure moved the industry to increase the amount of competition. However, because they did not have an information-based process to differentiate the performance and value provided by constructional professionals, the construction professionals started delivering construction as a commodity. Commodities have the following characteristics:
1. The best value is the lowest price.
2. Minimum standards define what is acceptable.
3. All options that meet minimum standards are “equal” and there is no differential.
4. There is no need to identify performance, use and analyze performance information, or continuously improve. All options are equal, and there is no competitive advantage to improve.
The design-bid-build low bid award is the largest delivery process of construction. Many of the alternate delivery processes that are supposed to be best value awards still use prequalification and low-bid awards. This is due to the difficulty to identify and compete performance as well as price. The low performance of the price-based environment can be verified by the following performance information:
1. 42% of the projects surveyed finished late, 33% were over budget, 13% had pending claims, and only 53% of the owners would ever use the same contractors again (Post, 1998).
2. From 1990-1997, over 80,000 contractors failed, leaving behind over $21B in liabilities (Dun and Bradstreet, 1997).
3. European construction nonperformance has had similar results (CIB, 2000, Egan, 1998).
Engineering News Record (ENR) publications has written articles that track the performance of construction projects and have identified the following nonperforming construction projects (Kashiwagi, 2004):
1. Ted Stevens Anchorage International Airport: Overbudget by $65M (28% of the budget overrun)
2. Civic Arts Plaza, California: Overbudget by $3.1M (50% of the budget overrun)
3. Criminal Justice Center, Texas: Overbudget by $23M (105% of the budget overrun), three years late
4. Central Artery/Tunnel, Massachusetts Design: Overbudget by $49M (13% of the budget overrun)
5. University of California’s Berkeley Campus Building, California: Overbudget by $29.4M (57% of the budget overrun) and months behind schedule
6. Tacoma’s Interstate Bridge of Glass, Washington: Overbudget by $.9M (32% of the budget overrun)
7. Seven Oaks Dam, California: Overbudget by $52.2M (34% of the budget overrun)
8. Hoover Dam Bridge: Overbudget by $42M (20% of the budget overrun)
9. California concrete bridge girders: Repair to cost $10M (83%)
10. Virginia interchange: Overbudget by $434M (180% of the budget overrun)
11. Oceanfront Diplomat Resort, Florida: Overbudget by $100M (25% of the budget overrun)
12. Nevada Jail and Courts: Three of four projects are over budget by $172M (143% of the budget overrun)
13. Commuter Rail Line, San Juan, Puerto Rico: Overbudget by $260M (16% of the budget overrun)
14. Safeco Field (Mariners), Washington: Overbudget by $100M (19% of the budget overrun)
15. Two Massachusetts Power Plants: Overbudget by $488M (150% of the budget overrun)
16. Wilshire-Normandie Subway Station, California: Overbudget by $20M (25% of the budget overrun)
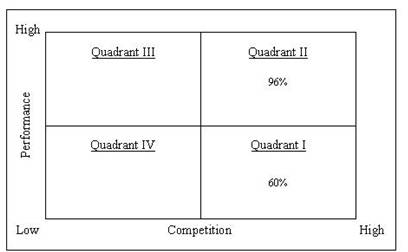
Figure 2: Construction Industry Structure Model
Quadrant II: 96% was calculated off the actual research results from 350 test
Quadrant I: 60% performance calculated from (Post, 1998, CIB 2000)
The industry needs to move from Quadrant I to Quadrant II to improve performance. Quadrant II is a process-based quadrant (Figure 2). The difference in performance of Quadrant I and II are shown in Figure 2 (96% vs. 60% performance). The 96% performance is the preliminary results of 350 tests of the performance-based procurement described in the next section. Quadrant I is price based, Quadrant II is performance based (on time, no contractor generated cost change orders, met the client’s expectations). Quadrant II minimizes the subjectivity of experts and uses performance numbers, while Quadrant I uses the subjectivity of experts to manage and control low performing contractors.
Performance Information Procurement System (PIPS)
The PIPS process is a Quadrant II process that was developed at Arizona State University in 1991. PIPS has created a Quadrant II environment. A Quadrant II process is defined by the following characteristics:
1. Transferring the risk to the contractor. If the owner transfers the risk to the contractor, the contractor will either be able to minimize the risk or show evidence that they cannot do the project. In a PIPS performance based environment, this has been shown 96% of the time. Instead of directing contractors to bid low (which increases risk, which the decision maker who is doing the directing is supposed to minimize through management and inspection), the new direction is to minimize risk. The ability to minimize risk is now the criteria for selection. If a client outsources, they do not manage unless the outsourced function cannot perform. A true outsourcing owner transfers risk. This is one of the foundations of PIPS, and has been tested out successfully over 350 times.
2. Selection is done by performance: past performance of key components, ability to identify, prioritizes, and minimizes risk in terms of money, time, and expectations.
3. Allows the contractor to be selected by their performance numbers.
4. Allows the contractor to clarify unknowns, use their expertise to minimize risk, and maximize their profit. This means that the person with the expertise is the one who must do the function.
5. The designer designs, and the constructor constructs. In other words, means and methods and material specifications are minimized. Construction management and inspection by the client’s representative is minimized. The interface between the designer and the contractor becomes one of risk minimization.
6. Minimizes all technical decision making of the client and their representatives.
7. Holds contractors liable for their performance by bar-coding all work. The bar coding is done with the past performance information. If a contractor doesn’t perform, his competitive barcode is modified. This past performance becomes a factor in the prioritization and selection of the best value.
The PIPS results in Utah, Hawaii, California, Arizona, and Georgia are as follows (Kashiwagi and Savicky, 2003a):
1. 350 tests of $240M in construction.
2. 96% on time, no contractor generated cost change orders, and 98% meeting the expectation of the owners.
3. Projects include maintenance and repair, renovation, and new construction.
4. Majority of projects (86%) were in the public sector.
These results propose that construction nonperformance may be a process issue and not a project technical issue. Owners have forced contractors to leverage volume and meet minimum requirements at the lowest possible costs. In this price based environment there is no incentive to improve (Erdmann 2002). The price based environment has gutted any effort to continuously improve. The contractors are currently submitting their best craftspeople in the performance-based environment (Winston, 1999, Lee, 2000). Contractors have a limited number of highly trained constructors. As the number of outsourcing owners who use the performance based environment (move risk to the contractors) increases, the supply of highly trained craftspeople will be depleted, and forcing contractors to have a system to train managers and craftspeople improve. PIPS is currently being tested by the Federal Aviation Administration, the United States Coast Guard, and Harvard University. More facility owners are becoming interested in entering the performance-based environment. The construction industry requires the following to ensure that the performance-based environment is stabilized:
1. Processes that are based on quality control instead of inspection and owner management.
2. Processes that document performance. This should be done by minimal inspection. In other words, inspection is minimized to a final walkthrough. The customer is then asked if they are satisfied. Information on whether the contractor finished on time, and without contractor generated cost change orders is annotated. The inspection is still done, but it is minimized by 80%.
3. Transparent process that verifies expectations.
4. Process that minimizes the need for management and control by the client’s representatives that will revert the environment back to a price based environment. By definition, a true performance based environment has a performer doing quality control. If the client is managing and inspecting the contractor, it is because they have hired a non performer. Management is required when people don’t know what they are doing. You do not manage perfomers.
The construction industry processes are currently set by standards. Once a standard is set, the movement is to meet the standard. Because the standard is always the lowest performance number, the movement of the contractors and manufacturers is usually downward. (Lam, 2001). Therefore there is no need for Six Sigma until a new environment is created. The authors propose using the Six Sigma program to meet the above four requirements in a performance based environment.
SIX SIGMA
Deming (1982) is the father of continuous improvement. His statistical control process and 14 points of continuous improvement is the forerunner of Six Sigma. Six Sigma is a rigorous and disciplined methodology that uses data and statistical analysis to measure and improve a company's operational performance by identifying and eliminating "defects" in manufacturing and service-related processes (iSixSigma LLC, 2004a). The goal of Six Sigma is to increase profits by eliminating variability, defects and waste that undermine customer loyalty (iSixSigma LLC, 2004b).
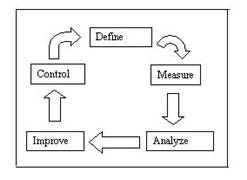
DMAIC, an integral part of the Six Sigma Quality Initiative, refers to a data-driven quality strategy for improving processes. DMAIC is an acronym for five interconnected phases: Define, Measure, Analyze, Improve, and Control (iSixSigma LLC, 2004c). DMAIC is a cyclical process as shown in figure 1 below.
|
|
|
|
Figure 3: DMAIC Cycle (GE.com, 2004)
The DMAIC process steps are as follows (GE.com, 2004):
D – Define. This phase defines the Customer, their Critical to Quality (CTQ) issues, and the Core Business Process involved. This includes:
1. Defining who the customers are, what their requirements are for products and services, and what their expectations are.
2. Defining the project boundaries and the timeline.
3. Defining the process to be improved by mapping the process flow.
M – Measure. This phase measures the performance of the Core Business Process involved. This is done by:
1. Developing a data collection plan for the process.
2. Collecting data from many sources to identify expectations.
3. Analyzing customer survey results to identify potential shortcomings.
A – Analyze. This phase analyzes the data collected and the process map to determine the root causes of defects and opportunities for improvement. This is done by:
1. Identifying gaps between current performance and goal performance.
2. Prioritizing opportunities to improve.
3. Identifying sources of variation.
I – Improve. This phase improves the target process by designing creative solutions to fix and prevent problems. This is done by:
1. Creating innovative solutions using technology and discipline.
2. Developing and deploying implementation plan.
C – Control. This phase controls the improvements to keep the process on the new course. This is done by:
1. Preventing reverting back to the "old way."
2. Requiring the development, documentation and implementation of an ongoing monitoring plan.
3. Institutionalizing the improvements through the modification of systems and structures (staffing, training, incentives).
Literature review (Young, 2001, Pullman, 2004, iSixSigma LLC, 2004a-2004d, Godfrey, 2002) showed the application of six sigma in various domains. Some of these domains, which the authors came across, were finance, healthcare, automobile, aerospace etc. However, a literature search did not identify any six sigma implementations in the construction industry. If PIPS and the performance based environment continues to increase in popularity, a documented process such as Six Sigma can help contractors continuously improve.
Six Sigma Application
This paper proposes that Six Sigma can be used by contractors to enlarge the performance environment of the construction industry. The following is a proposal to implement Six Sigma in conjunction with the PIPS performance based environment.
D – Define. The customer in construction is the client. The authors propose that construction performance should be defined as on time, no contractor generated cost change orders, and meeting the expectation of the clients or facility owners. Performance is non-technical. Performance information must be non-technical terms. If the performance information were in technical terms, the owner would have to direct the contractor. All performance information must be related to the following:
1. Finishing early.
2. No contractor generated cost change orders.
3. Exceeding the expectations of the owner.
M – Measure. This phase measures the performance of the contractor’s processes. Figure 4 below briefly depicts a typical high-level process of a performance based construction environment.
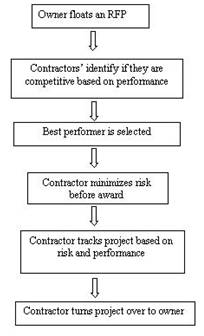
Figure 4: Typical high level process map in the performance environment
In the performance environment, the outcome depends on the performance of the contractor. From the results of the 380 tests, once an owner has had very little selects and awards a project to the contractor, there’s very little that an owner can do to change the eventual outcome. This concept has been validated by the PIPS tests. The measurement of performance should be accomplished by the contractor. The contractor should know their and their competitors performance before the bid, should be measuring their performance and minimizing risk during the project without the aid of the client’s representatives, and communicating to the client in terms of the performance information. Contractors should be measuring:
1. Performance of competing contractors.
2. Performance of all key personnel within the company.
3. Performance of critical subcontractors.
4. Performance of projects for different owners.
5. Profit margins of projects for different owners, personnel, and subcontractors or general contractors.

Figure 5: Analyze Phase (Waddick, 2004)
A – Analyze (Figure 5). Contractors should be constantly evaluating their performance. A performance-based environment minimizes the subjective decision making of the owner. Contractors control their own destiny in the information based free enterprise environment. Tools are available in the statistical world, which can help in performing a root cause analysis. Some of these include:
1. FMEA – Failure Mode Effect Analysis
2. Ishikawa Diagram or Fishbone diagram
3. The 5 Why’s
The details of the above tools can be found in reference (Hoerl & Snee, 2002). The authors believe that this analysis will lead to the conclusion that the root cause of failure of construction projects to complete on time, within budget without cost generated change orders and to meet owners expectations lies in either the construction delivery process or the process by which a contractor performs the construction. This is analogous to the common cause variation in the statistics world. The testing of PIPS which uses a process approach rather than the traditional project approach of the price based environment, has been much more successful in deliverying construction performance. (Reference) This difference is depicted in figures 6 and 7 below.
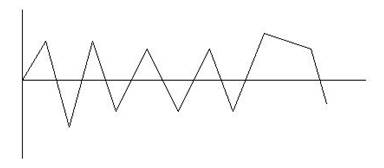
Figure 6: Common Cause variation (Process Specific)
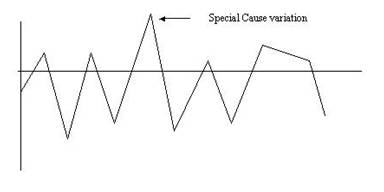
Figure 7: Special Cause variation (Project specific)
Normally, project specific actions are taken to achieve the desired results due to nonperforming processes. These actions are reactive, non-efficient, and not performance based. The process based solution is to treat construction as a process which can be continually improved. This justifies implementing continuous improvement. Continuous improvement can only be accomplished with measurement and analysis of performance information. The process approach will ignore the project specific data and identify the root causes of nonperformance.
I – Improve. The performance based environment of PIPS forces the contractors to continuously improve to stay competitive. Contractors who do not have a continuous improvement or DMAIC process, they will not be successful in the performance-based environment. In both the State of Hawaii, and State of Utah environments, contractors who depended on project specific solutions, were not successful (Kashiwagi & Byfield, 2002). In both cases, it ended up being detrimental to the owner’s efforts to maintain a performance based environment. In the State of Utah, contractors who perceived they were performers objected to the performance-based environment, and convinced the government to return to a more project specific environment. This meant less performance information, more subjective decision making by the client’s experts, and no requirement for a contractor to have a continuous improvement program. In the State of Hawaii program, a contractor who could not win projects based on performance protested the process. The contractor was not fully educated and did not have a DMAIC process in place. The contractor ended up performing very poorly.
The State of Hawaii PIPS roofing program test had the following characteristics (Kashiwagi and Savicky, 2003b):
1. Time period of over four years.
2. Procurement of 100 roofs.
3. The performance of six contractors was tracked over the four years.
4. Contractors with DMAIC processes in place were more successful.
5. Contractors without DMAIC processes did not participate.
6. The performance based contractors performed work twice as quickly, installed roofs with no leaks, and provided enforceable warranties which were ten years more than previously issued.
Lessons learned from the two experiences show that it is critical for contractors to implement Six Sigma practices to make a performance-based environment sustainable. If this is not done, the following detrimental results will occur:
1. Motivate nonperforming contractors to protest the process with the claim that it is noncompetitive and exclusionary.
2. Frustrate nonperforming contractors who do not understand performance.
3. Give support to non-value added management type personnel who would much rather revert to the status quo, inefficient processes that favor nonperforming contractors and bureaucratic managers.
4. Create an environment of confusion where performance and value are not understood.
It is the opinion of the author that, in both Hawaii and Utah PIPS programs, an implementation of a DMAIC program with the contractors would have improved the sustainability of the program. In both cases one of the problems was the presentation of information in a timely manner. In both cases, the procurement programs were modified before the information could be presented. DMAIC methodology would have delivered the information and possibly changed the outcome.
C – Control. It is vital that contractors understand that they must control their own performance and performance information. The performance-based environment will provide a motivation to continuously improve. By definition of the performance-based environment, the client does not control the contractor. Therefore, the way for the client to control the environment is to ensure that the contractors are keeping their owner performance information and controlling their performance. The client then controls by forcing the contractors to control themselves, using the performance-based environment to minimize the risk of a nonperforming contractor getting a project. The risk to the process is then defined by nonperforming contractors destabilizing the environment with political pressure and considers the process as unfair and exclusionary. The most important function of the client’s representatives becomes to ensure that the performance information is being kept, managed, and used by the contractors. The environment will then regulate itself by forcing contractors to practice the most value added processes.
A performance-based environment differs from the price-based environment because it requires continuous improvement that is not managed by the client. This was identified by the 350 tests of PIPS. Without a continuous improvement program, the program may be unsustainable. The authors suggest using a Six Sigma program in conjunction with PIPS. The Six Sigma program should be a requirement of the PIPS environment. The client must emphasize that PIPS is a self-regulated process where contractors regulate each other through use of performance information. A form of DMAIC will be introduced into all PIPS tests and implementations, a rating process of the impact will be created, and the impact shall be measured.
References
CIB. (2000, May). The State of the Construction Industry Report. Construction Industry Board (CIB). [11]. URL: http://www.dti.gov.uk/construction/stats/soi/soi11.htm.
Deming, E. W. (1982). Out of the Crisis. Cambridge, MA: Massachusetts Institute of Technology.
Dun and Bradstreet. (1997). Dun & Bradstreet Business Failure Record, 1990-1997. Surety Information Office (SIO). Date accessed (12/29/2003) URL: http://www.sio.org/HTML/whyfail.html.
Erdmann, Rudy. (2002). The Relationship Between the Design-Bid-Build (DBB) System and Construction Nonperformance. Unpublished Masters Thesis, Arizona State University, Tempe.
Egan, J. (1998). Rethinking Construction: The Report of the Construction Task Force. Department of Trade and Industry, pgs. 1-37.
GE.com. (2004). GE Capital Vendor Financial Services DMAIC Process. URL: http://www.ge.com/capital/vendor/dmaic.htm
Godfrey, A.B. (2002, February). The Honeywell Edge. URL: http://www.asq.org/pub/sixsigma/past/vol1_issue2/honeywell.html. also in Six Sigma Forum Magazine, 1[2].
Hoerl, R.W. and Snee, R.D. (2002). Statistical thinking: improving business performance. California: Wadworth Group – DUXBURY.
Kashiwagi, Dean. (2004). Best Value Procurement: Theory & Practice Manual. Tempe, AZ: PBSRG, Arizona State University.
Kashiwagi, Dean and Savicky, J. (2003a). “Case Study of the Implementation of the Performance Information Procurement System at the Dallas Independent School District.” Associated Schools of Construction (ASC) International Proceedings of the 39th Annual Conference, Clemson, SC, pgs. 315-323.
Kashiwagi, Dean and Savicky, J. (2003b) The Cost of ‘best value’ Construction. Journal of Facilities Management, 2[3], pgs. 285-295.
Kashiwagi D. & Byfield R. (2002). Testing of Minimization of Subjectivity in ‘Best Value’ in Procurement by Using Artificial Intelligence Systems in State of Utah Procurement. ASCE: Journal of Construction Engineering and Management, 128 [6], pgs. 496-502.
Lam, Patrick, Mohan Kumaraswamy, S. Thomas. (2001). The Multiple Roles of Specifications in Lean Construction. Lean Construction. URL:http://cic.vtt.fi/lean/singapore/Lametal.pdf.
Lee, Deidre A. (2000, May). Best Practices for Collection and using current and past performance information. Office of Federal Procurement Policy.
Post, N. (1998, May 11). Building Teams Get High Marks. Engineering News Record (ENR), 240 [19], pgs. 32-39.
Pullman Memorial Hospital. (2004). Raising the Bar – A Quality Model for Hospitals (news release) URL: http://www.pullmanhospital.org/current_news_releases/raising_the_bar.htm.
iSixSigma LLC. (2004a). What is Six Sigma? URL: http://www.isixsigma.com/library/content/six-sigma-newbie.asp.
iSixSigma LLC. (2004b). Six Sigma. URL http://www.isixsigma.com/dictionary/Six_Sigma-85.htm.
iSixSigma LLC. (2004c). DIMAIC Problem Solving Methodology. URL http://www.isixsigma.com/dictionary/DMAIC-57.htm
iSixSigma LLC. (2004d). Ford Embraces Six Sigma. URL: http://healthcare.isixsigma.com/library/content/c010614a.asp
Waddick, P. (2004). Six Sigma DIMAIC Quick Reference – Analyze Phase. URL http://www.isixsigma.com/library/content/six_sigma_dmaic_quickref_analyze.asp
Winston, Sherie. (1999, October 4). Pentagon Pumps Up Performance. Engineering News Record, 243 [14], pg. 10.
Young, J. (2001, November) Driving Performance Results At American Express. URL http://www.asq.org/pub/sixsigma/past/vol1_issue1/driving.html Also in Six Sigma Forum Magazine, 1(1), no page given.