![]()
![]()
![]()
- ASC Proceedings of the 40th Annual Conference
- Brigham Young University - Provo, Utah
- April 8 - 10, 2004
|
|
|
A Contractor’s Profit Analysis
Contractor’s profit margin is affected by the performance of estimators, project managers, and clients. The authors propose that contractors can maximize profit by moving out of the price-based environment and also by using completed project profit analysis (CPPA). The research proposes that CPPA may be more successful to maximize the profit of the contractor rather than attempting to improve the performance of their personnel. The study assumes that a successful contractor will have competent personnel (estimators and project managers) who will try to maximize the profit of the contractor. The paper analyzes a contractor’s profile of projects to validate the hypothesis. The paper also proposes that the work-in-progress (WIP) reports are not as effective in identifying the ability of a contractor to maximize profit as the CPPA.
Keywords: Performance Information, Best Value, Minimizing Risk.
The construction industry has been synonymous with low profit margins. An AGC profit margin study, published in the Engineering News Record, identified contractors that make more than 5% annually as “high-profit” firms. Seventy-nine percent of all contractors make less than 5% annually (ENR Staff Writer, 1993). The industry has accepted low margins as the norm, and has done very little to investigate why profit margins are so low in such a high-risk industry. These returns, combined with high risk, keep contractors in a constant mode of survival. Inconsistent work volumes, disputes on projects, and late payments leave the average builder little margin for error.
The industry was dramatically impacted by the downturn that followed September 11, 2001. Recent articles report that margins are, “down anywhere from 40% to 75%” (Trager, 2003). “U.S. revenue for the Top 400 dropped 2.9% in 2002, to $174.79 billion” (Tulacz & Powers, 2003). Clearly, a contractor must be an exquisite businessman to succeed. Unfortunately, most are not. “More than 80,000 contractors failed during 1990-1997, leaving a trail of unfinished private and public construction projects with liabilities exceeding $21.8 billion” (SIO, 2003). One might assume that most of these failures were startup companies or merely “flash in the pan” failures. However, the largest percentage of failures occurred with companies that have been in business for 10 years or longer (Construction Chart Book, 2002). To complete this picture, the construction industry boasts a failure rate that is 30% higher than that of the national average (Schaufelberger, 1999).
Even with all the trials and tribulations, some contractors have managed to make a profit. Contractors fluctuate personnel to match an ever-changing volume of work and accept work at or near cost to cover overhead. The aforementioned may sound like a well orchestrated, well understood sequence of events, but the reality is that most contractors’ best gauge for industry patterns and trends has been a “sixth sense.” For those that have it, it seems as clear as day. For others, failure may be eminent.
For the few that have managed to succeed, is it possible to improve profit margins to a point where it begins to justify the risk of non-profitable work? The reality is that other than the widely accepted profit margins that have been published over and over, very little has been done to study where profits are made and lost. Does the average contractor spend all of the time working on projects that average 3% or spend time earning 6% on one project in order to give back 3% on another?
Contractors utilize a work-in-progress (WIP) report to track projects that are underway. These reports are often used by bonding companies as a benchmark of a contractor’s competency in estimating and managing a project to completion, at a projected profit margin. These reports are monthly profit margin projections that are created by the project manager. Each month, the manager updates the estimated cost to completion for any projects that are ongoing and forecasts the profit that will remain at the end of the project. Contractors utilize this method of tracking projects to appease bonding companies or as a means of internal control. Resources are spent to create and review these reports. In theory, the objective of the reports is to improve the company’s profitability. Although these reports are useful in determining a project manager’s ability to forecast costs, it does very little to impact profitability. It is a perception that these forms provide a level of accountability and motivate project managers to maximize a project’s profitability. However, a good project manager will do everything in his/her power to complete a project as cost effectively as possible without the WIP process. The authors propose that the WIP reports more information on whether a contractor made a profit, but does not identify if the maximum potential profit is made.
Many WIP reports will contain a graph that depicts the profit margin as a function of time. A project that was estimated and managed properly will have a graph that should resemble (Figure 1). Series 2 indicates the estimated profit margin, and series 1 reflects the actual project margin as the project was completed. This project was originally estimated with a profit of 2.85% through the duration of the project. The reality is that the project ended just shy of 3%. In an ideal world, all projects would begin with an estimated profit margin and that margin would increase or be maintained to the end of the project.
Figure 1: WIP Report
An idealistic WIP Report. The estimated profit line is established at 2.85% at the beginning of the project or via the estimate. Ideally, the actual profit will meet or exceed the estimated profit through the course of the job.
The reality for many projects is that actual margin (estimated cost – final costs) reduces through the course of the project. A recent article referring to diminishing returns on construction projects stated, “All too often, when a project reaches its late stages, the apparent earnings can fade like a pair of blue jeans left out in the sun (Daniels & Illia & Korman, 2002).” With a bonding market that is growing weary, more time than ever is being spent creating and analyzing WIP reports.
The perception in the industry is that if a contractor wants to improve profitability, it will employ quality estimators and project managers. The authors propose that the quality of the estimators and managers is a function of competency. If the bid or cost estimate is low, the money will come out of the profit. Competent management does not increase fees to account for estimating shortcomings. At the same time, an estimator who accurately estimates the cost of the work and includes a fee that exceeds what the market will bear will not have a job for very long. An estimator must bid the work at a very low profit margin to get the work, therefore the profit benchmark has already been set, and long before the project manager arrives on the scene.
The construction industry is divided into four main quadrants (Figure 2). The quadrants are shaped by the factors of competition and performance. The two quadrants that make up the bulk of the industry are Quadrant I the low bid environment and Quadrant III, the negotiated bid environment. Quadrant I has the following characteristics:
Quadrant III has the following characteristics:
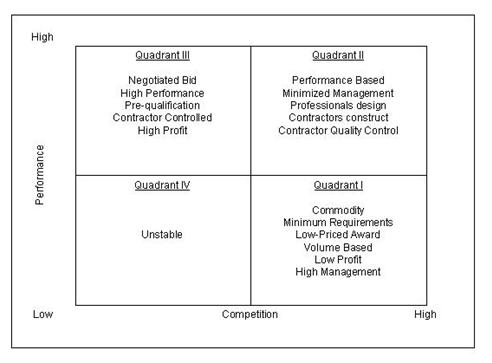
Figure 2: Construction Industry Structure
In a highly competitive price based environment (Quadrant I), contractors will receive projects based on the following:
A project’s profitability, or lack there of, is already established by the time that the project manager is struggling with the WIP report. A manager may be able to improve a project’s profitability slightly by selling additional work at change order percentages, but the overall all margin will not be impacted. Even in a market that is very competitive, some projects are better than others. Some owners want reasonable competition and restrict the field to pre-qualified competitors.
The authors propose that the key to improving profit margins is identifying which owners take performance into consideration. The authors also hypothesize, that owners who are consistently focused on the lowest price regardless of the quality of the work will not be a very profitable venue. Those who must continuously shop, even if there are a half dozen competitive quality contractors, will consistently award projects that have little to no profit in them. These same owners will consistently get bids from new contractors who are attempting to establish a new client, which normally results in projects going at or near cost. The authors propose that if a company wants to increase profitability, it will closely examine the clients that it works for and ultimately the way that the projects are awarded.
The construction industry’s constant fluctuation leaves very little time for reflection on the performance and profit of completed projects. Most successful contractors will spend some time learning from past mistakes, but will not analyze profitable projects. The authors propose that contractors should analyze the completed projects for profit differential considering the different owners, project managers, and estimators. This analysis will prioritize the factors affecting profit. Most companies only analyze projects that missed the profit projections by a large margin. This analysis will generally result in some sort of adjustment that minimizes the contractor’s chance of repeating the mistake. The authors propose that the most valuable information lies outside of this type of analysis. The authors propose that a study of successful completed projects will produce information to maximize profit. This approach is a process approach instead of a project specific approach.
In the event that a contractor is one of the elite (that consistently generates yearly returns over 5%), and does the majority of work in Quadrant III, a successful contractor can maximize profit by understanding which clients projects are maximizing the contractor’s profits. This is the objective for completed project performance analysis (CPPA.) If the majority of the contractor’s work comes from price based bid work, profits may be minimized. However, even if a contractor is involved in performance-based work, it is important to carefully scrutinize completed cost information to verify that performance based work is maximizing the contractor’s profit. Project teams that invest time working on a project, which generates very little revenue, or barely covers costs should not be maintained since it brings risk to the contractor. The profile of an owner that is employing a profitable format, for a specific contractor, must be understood and pursued. The authors hypothesize that the client’s profile can affect profit margin more than differential among estimators or project managers. The authors also hypothesize that the profit in Quadrant III is much higher than Quadrant I.
A contractor was identified to provide project cost information for analysis. The information was provided in the form of estimated costs (as bid by the estimating department), and final costs (as posted in the accounting system). The intention was to do an analysis strictly on project profitability. Upon reviewing the costs as delivered from their accounting system, it became clear that like many other contractors, the company’s overhead and management costs have not been allocated to each individual project. Each project has a fixed figure that was allotted to cover overhead and supervision, but no costs have been posted to each project.
The analysis of the completed projects will focus on earned income or revenue generated by each project rather than profit. Revenue is a loosely used word. “It is a general term to encompass both earning and income (Askew & Mawdesley & O’Reilly, 1997).” For the purposes of this research, revenue is defined as estimated contract cost less final costs. Project supervision and overhead are not included in the final project costs. Therefore company overhead (including project supervision and estimating) must be reduced from the annual revenue prior to having a profit or loss figure for the year. This also helps maintain the confidentiality of the company’s pricing structure. If the trends exist, looking at revenue or profit margins can identify them. . This analysis will consist of examining revenue as defined above instead of profit.
The projects that have been submitted vary in dollar value from $450 dollars to $830,000 (Table 1). The average margin for the company over the one-year period was calculated and compared to the owner, project team, and estimator. This data was then analyzed to determine if there were any trends.
Identifying how an Owner is selecting and hiring a contractor will result in a better understanding of each Owner’s profile. For instance, some contractors are hired based on a combination of past performance and price. Other Owners hire strictly based on price. The different contracting formats will be broken into basic types according to the Construction Industry Structure (CIS).
Table 1
|
No |
Criteria |
Results |
|
1 |
Owners |
14 |
|
2 |
Number of Projects |
114 |
|
3 |
Projects + (Est. Cost - Final Costs) |
106 |
|
4 |
Projects - (Est. Cost - Final Costs) |
8 |
|
5 |
Smallest Project in Data |
$ 437 |
|
6 |
Largest Project in Data |
$ 829,729 |
|
7 |
Contractors Profitability 2002 |
2% |
|
8 |
Total Contracts Reported |
$ 3,987,481 |
|
9 |
Revenue as a percent of Volume |
12.4% |
|
10 |
Distribution of Projects |
|
|
10a |
Hard Bid |
109 |
|
10b |
Hard Bid Rev. / Volume |
11.6% |
|
10c |
Negotiated |
5 |
|
10d |
Negotiated Rev. / Volume |
16.8% |
In order to have an understanding of where revenue is coming from, a company must analyze all of the projects collectively. Deviations that are a function of personnel, format, or clientele will go unnoticed without a holistic approach.
The contractor worked for a total of fourteen different owners during the 2002 fiscal year and returned a profit of 2%. The vast majority of the projects were awarded via the Quadrant I bidding process. Negotiated work made up a little over 4% of the projects. As hypothesized, the negotiated work was more profitable than the price based work.
One hundred and six of the one hundred and fourteen projects generated income for the company (Figure 3). The other eight projects were completed over the estimated costs. In an environment that is very low in margin, it is imperative to avoid funding a project to completion. Most contractors will confess that if a contractor “aggressively” pursues a large number of hard bid projects in a lean market, sooner or later end up losing money on projects.
From analysis of the CIS and observing the companies overall return, it is clear that the hard bid projects were completed in Quadrant I. From the results of the owners’ surveys, high competition is encouraged in the bidding process. Eight out of the fourteen owners regularly invite new contractors to the table. The remaining six owners prefer to work with previous contractors (the expectations are already known).
The negotiated projects were contracted based on higher risk (schedule driven), with lower competition. Clearly from the analysis of the average return in Quadrant I versus that of Quadrant III, the format of the work will impact the return on the project as one would expect. The extreme level of competition that is in Quadrant I will consistently drive the contract values and margins down. All five of the negotiated projects were design-build projects with the contractor leading the design effort. All five projects fit into Quadrant III of the CIS.
Figure 3: Low-bid Projects
Having established company’s overall performance numbers, the employees were analyzed against the benchmarks. The two estimators’ projects are compared in Table 2.
Table 2
Performance Information on Estimators
|
Title |
Dollar Volume |
CO |
Avg. Proj. |
Rev. |
Rev / Vol |
|
ESTIMATOR / PM |
$ 2,423,101 |
2.36% |
$ 71,267 |
$ 274,449 |
11.33% |
|
ESTIMATOR / PM |
$ 1,477,130 |
5.31% |
$ 18,464 |
$ 231,243 |
15.65% |
This table reflects the actual performance information, or completed costs, for all of the projects that each estimator was successful on or awarded during the fiscal year. The work has been examined to reveal the amount of change orders that were approved during the work, the average project size that each estimator was successful on, the total amount of revenue that was earned, and ultimately the percentage of revenue earned to volume of work performed.
By examining the results of Table 2, the completed projects indicate that both of the estimators are bidding consistently. Estimator 1 has a slightly lower revenue to dollar volume ratio, which is to be expected with a considerably higher average project size. As the size of job gets smaller, the fee that is required to complete a project must increase to compensate for the reduction in volume. It is apparent from the revenue / volume percentages that the estimators estimates correlated to the company’s overall revenue to volume benchmark of 12.36%. Estimator 1 is slightly below due to the larger size of his projects, and Estimator 2 is slightly above that due to the small size of his projects. The income (revenue) to volume ratios is consistent with the numbers that both estimators provided when interviewed. Both estimators provided ranges that were driven by the size of the project. From the results of the cost information, the project costs are being estimated within a reasonable tolerance by both of the estimators.
Given the margin percentages above, it is reasonable to deduce that projects up to $80,000 should bring revenue at 10% or higher. It is reasonable to infer that projects under $18,000 should have revenue greater than 15%. These benchmarks will be utilized to analyze the performance of the superintendents and Owners.
Table 3
|
Title |
Dollar Volume |
CO |
Avg. Proj. |
Rev. |
Rev / Vol |
|
SUPER 5 |
$ 829,729 |
3.05% |
$829,729 |
$ 63,218 |
7.62% |
|
SUPER 2 |
$ 683,654 |
4.51% |
$ 22,053 |
$ 64,923 |
9.50% |
|
SUPER 1 |
$ 1,171,233 |
0.00% |
$ 50,923 |
$ 187,892 |
16.04% |
|
SUPER 3 |
$ 987,204 |
7.56% |
$ 26,68 |
$ 160,718 |
16.28% |
|
SUPER 4 |
$ 162,057 |
4.25% |
$ 10,803 |
$ 31,219 |
19.26% |
This table reflects the completed cost information for the Superintendents. The analysis was performed and the information is conveyed in the exact same format as above for the estimators (See Table 2).
The contractor utilized five different superintendents over the course of the year. The percentage of revenue to dollar volume checks out for four of the five superintendents. The smaller the average project size, the higher the margins should be. The established benchmark of 10% or higher for all projects under $80,000.00 holds true for all of the superintendents except for superintendent number two. This employee’s projects should be analyzed by both of the estimators to identify if the project manager’s portfolio included a large number of “low income” projects or if he lacks the ability to complete the projects as estimated.
Inspection of the projects identifies multiple projects for fourteen of the fifteen owners. Owners G and H are clearly preferable. Clients A, C, and I are below the margin benchmarks that were established above. The authors recommend identifying perceived issues with owners A, C, and I including format, extreme competition, or other reasons that result in low profit projects.
Table 4
|
Title |
Dollar Volume |
CO |
Avg. Proj. |
Rev. |
Rev / Vol |
|
Client A |
$ 19,959.00 |
4.25% |
$ 4,989.00 |
$ 520.00 |
2.61% |
|
Client B |
$ 20,320.00 |
0.00% |
$ 10,160.00 |
$ 3,303.00 |
16.25% |
|
Client G |
$ 61,216.00 |
16.67% |
$ 10,202.00 |
$ 19,153.00 |
31.29% |
|
Client F |
$ 108,623.00 |
2.93% |
$ 12,069.00 |
$ 16,793.00 |
15.46% |
|
Client D |
$ 34,235.00 |
1.27% |
$ 17,177.00 |
$ 7,918.00 |
23.13% |
|
Client C |
$ 54,455.00 |
4.27% |
$ 18,151.00 |
$ 3,381.00 |
6.21% |
|
Client N |
$ 863,616.00 |
3.62% |
$ 19,627.00 |
$ 132,603.00 |
15.35% |
|
Client M |
$ 440,287.00 |
-3.60% |
$ 23,173.00 |
$ 65,879.00 |
14.96% |
|
Client K |
$ 468,384.00 |
9.17% |
$ 31,225.00 |
$ 59,742.00 |
12.75% |
|
Client I |
$ 265,882.00 |
1.3% |
$ 66,470.00 |
$ 25,001.00 |
9.40% |
|
Client E |
$ 112,999.00 |
33.30% |
$112,999.00 |
$ 9,220.00 |
8.16% |
|
Client H |
$ 123,724.00 |
0.00% |
$123,724.00 |
$ 24,853.00 |
20.09% |
|
Client J |
$ 353,761.00 |
0.00% |
$176,880.00 |
$ 56,940.00 |
16.10% |
|
Client L |
$ 829,729.00 |
3.05% |
$829,729.00 |
$ 63,218.00 |
7.62% |
Table 4 depicts the completed cost information for each of the contractor’s projects grouped by Client. This information has been sorted by average project size. For instance, Client A’s average project size is the smallest at $4,989.00. The total amount of contract work performed for Client A during the fiscal year 2002 was $19,959.00. Revenue was established after all costs for the project have been accounted for and all change order posted. Revenue is calculated as the total contract amount less the total project costs excluding overhead and management.
The contractor’s profitability in 2002 reflects that the majority of the contracts are being completed in Quadrant I. Obtaining more work in Quadrants II or III will increase the company’s yearly return. Completed Project Profit Analysis (CPPA) is a tool that a contracting company can employ to understand where income is coming from, assess the performance and competency of key personnel, and ultimately prioritize clients to maximize profitability. Upon inspection of a contractor’s cost information, there were performance trends that indicate that some clients are clearly more profitable than others. The hypothesis concludes there would be a clear revenue trends and the variations caused by clients would be much more substantial rather than the variations caused by estimators and project managers. Clearly, competent employees are critical in the construction industry due to the inherent risk of the work, but are not the key to increasing margins. Their main role is to minimize risk. The authors recommend that contractors maximize profit by analyzing completed project results by CPPA.
Askew, W., Mawdesley, M., and O’Reilly, M. (1997). Planning and Controlling Construction Projects. Berkshire: Addison Wesley Longman.
Construction Chart Book. (2002, September). The Construction Chart Book (3rd ed.). The U.S. Construction Industry and Its Workers.
Daniels, S., Illia, T. and Korman, R. (2002). Don’t Fade Away: Waning Construction Profits Show Weak Reporting. Engineering News Record (ENR).
Schaufelberger, John. (1999). Risky Business, Why so Many Contractors Fail. Seattle Daily Journal & The University of Washington.
SIO. (2003). Why do Contractors Fail? Surety Bonds Provide Prevention & Protection. SIO Surety Information Office. URL http://www.sio.org/HTML/whyfail.html
ENR Staff Writer. (1993, June). AGC profit study released. Engineering News Record (ENR), 231 [17], pg. 19.
Tulacz, G. J. and Powers, M. B. (2003, May). Broad Downturn Touches Most. Engineering News Record (ENR), 250 [19], pg. 62.
Trager, C. S. (2003, May). Nonprofits can be profitable; Keep construction firms busy; for how long? Crain’s New York Business, 19 [19], 35.