![]()
![]()
![]()
- ASC Proceedings of the 40th Annual Conference
- Brigham Young University - Provo, Utah
- April 8 - 10, 2004
|
|
|
Web-based Vector Graphics for Integrated Design Automation
Most retaining walls and box culverts built for arterial road construction are simple, and the design process of these structures is often repetitive and labor-intensive because they are so similar in structural configuration. Although some integrated design automation systems developed for retaining walls and box culverts have expedited the design process of these structures, the process of collecting and distributing the resultant engineering documents has not been fully integrated with the computer applications. We have developed a Web-based parametric design-support system to manage the resultant documents as well as to speed up the repetitive design process. This paper shows how we have applied Web-based vector graphics, such as Vector Markup Language (VML) and Scalable Vector Graphics (SVG), to integrate and automate the design of repetitive structures.
Key words : Design Automation, Web, XML, VML, SVG
Introduction
Every year, many simple structures such as retaining walls and box culverts are designed for road construction. The design process for these structures is often repetitive because they are so similar in structural configuration. Professionals in the Architecture, Engineering, and Construction (AEC) industry have tried to speed up repetitive design processes by using such computer applications as structure analysis packages and CAD packages. These computer applications have successfully facilitated the process of analyzing structural stability, selecting optimum structural members, and producing CAD drawings. However, the resultant data generated by one application have sometimes had to be delivered to succeeding applications almost manually. Lack of connectivity among applications has resulted all too easily in information loss or duplication during design. In order to improve the design process for simple and repetitive structures, some professionals in the AEC industry have developed integrated computer applications with which engineers can implement all design tasks seamlessly, from the analysis of structural stability to the generation of CAD drawings. Usually these computer applications automatically take design parameters such as the geometry of a structure and implement all the engineering calculations needed to generate engineering reports and drawings. However, most integrated design automation systems were developed for stand-alone computer systems. Accordingly, many engineers have to depend on additional tools to exchange their resultant engineering documents with others.
Application of Information Technology (IT) in construction projects has helped construction professionals realize that effective document management, especially in a central repository, is an essential step in organizing the lessons learned from completed projects and using them on the next project. The public sector in the construction industry was also interested in creating project legacy data to use in making decisions about how to maintain the built structures. Indeed, in many fields it has been notoriously difficult to create, access, and adapt project legacy data effectively. Unless the entire process from engineering design to document management is integrated, creating project legacy data remains problematic. Web-based project management, which facilitates the collection and sharing of project information over the Internet, therefore has attracted professionals in the construction industry.
One obstacle in using integrated design automation systems to create project legacy data with Web-based project management is that most integrated design automation systems do not support management of the resultant documents. The resultant engineering documents are often delivered almost manually to the central Web-based repository for project management. In addition, representation of vector graphics in the Web page, which is one of the critical requirements for manipulating engineering CAD drawings over the Internet, was difficult until the recent emergence of Internet technologies such as Extensible Markup Language (XML), Vector Markup Language (VML), and Scaleable Vector Graphics (SVG). XML is a text format designed to manipulate large-scale electronic publishing and data exchange over the Internet. VML and SVG are applications of XML which define tags for illustrating vector graphics in the Web page. The growth of compatible Internet design technologies has inspired us to develop a Web application that integrates the entire design process for simple structures on the Web.
Available design automation systems
Several parameter-based design automation systems have been developed and used to facilitate simple repetitive design. Most of these systems aid the (1) analysis of structural stability, (2) selection of optimum structural members, (3) generation of engineering reports and CAD drawings, 4) generation of the bill of materials, and other miscellaneous tasks. Hyundai Institute of Construction Technology (http://www.hdec.co.kr/technology) in Korea developed a design automation system for steel box bridges which attempts to optimize bridge design by integrating structural analysis, member design, and AutoCAD drawing generation. Hangil IT (http://www.aroad.co.kr) in Korea supplies a series of computer applications to help design simple structures for road construction. ACulvert of Hangil IT, for example, is designed to accelerate box culvert design by facilitating structure analysis, member design, and drawing generation. Construction Consulting Group (http://www.ccginc.co.kr) in Korea offers G-Wall, G-Culvert, and G-Rahmen to support the repetitive design of retaining walls, box culverts, and rahmen-type simple bridges. ENERCALC (http://www.enercalc.com) in the United States offers the Structural Engineering Library (SEL), a set of structural programs for expediting repetitive structural analysis. Geosolve (http://www.geosolve.co.uk) in the United Kingdom supplies WALLAP, an application for retaining-wall design, to help design various retaining walls such as cantilevered walls, anchored walls, and strutted walls. Some applications, such as InRoads Bridge of Bentley Systems (http://www.bentley.com), run on top of a commercial CAD package to help generate CAD drawings while others, such as ACulvert of Hangil IT (http://www.aroad.co.kr), supply their own CAD engine to generate DXF drawings.
Although computer applications like these have shown that they can save significant amounts of time in designing simple and repetitive structures, they seldom support management of the resultant documents. Engineering firms often depend on a separate document management system for building project legacy data and using them on the next project. They also have to develop a protocol for engineers to follow when collecting and circulating the resultant engineering documents. However, omission and duplication of information still seems to be an almost universal problem.
Existing technologies for Web-based vector graphics
Bitmap graphics, such as raster images and photos, successfully represent graphical information on the Web page. Bitmap graphics are described by millions of pixels in a binary format such as GIF and JPEG, which require a special package for modification. As opposed to bitmap graphics, vector graphics are described by a series of points to be connected. Vector graphics are resizable to any proportion without sacrificing graphical resolution. They are flexible because they can simply be re-rendered at any point. In order to facilitate the representation of vector graphics on the Web, the World Wide Web Consortium recently released both Vector Markup Language (VML) and Scaleable Vector Graphics (SVG), which are XML-based formats for vector graphics.
Extensible Markup Language (XML)
XML is a simple and flexible text format derived from the ISO 8879 Standard Generalized Markup Language (SGML). It is called extensible because it is not a fixed format like Hyper Text Markup Language (HTML). Originally designed to meet the challenges of large-scale electronic publishing, XML is also playing an important role in the exchange of a wide variety of data on the Web. Teague et al. (2003) defined XML as “a set of formatting rules that define structured information in a software-neutral text file.” Since XML defines the structured information in a simple text file, it can be recognized by virtually any computer system. Thus XML is very appropriate for building software-neutral project legacy data. By utilizing XML Stylesheet Language Transformations, information defined in XML can then be transformed into a common HTML document represented on the Web page.
In 1999, the International Alliance for Interoperability (IAI) proposed aecXML, an XML-based language designed for exchanging information in the AEC industry. Harrod (2003) noted that “the main idea with aecXML is to not only establish some standard ways of structuring building data but also to do it so as to enable automated processing of that data as much as practicable.” Zhua and Issab (2003) suggested that a well-developed XML schema to classify construction data is a critical key issue for successful information exchange. Using the XML-based information standard, Tserng and Lin (2003) developed an electronic data acquisition model for project scheduling. They pointed out two major obstacles in gaining efficient access to information about multi-contract projects: 1) the variety of data structures that project participants use, and 2) the lack of an automatic mechanism for data acquisition.
Vector Markup Language (VML)
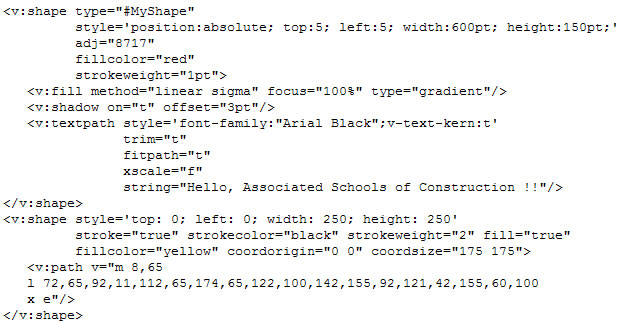
VML is an application of XML which defines a format for encoding vector information together with additional tags for editing and displaying the information. VML is written using the syntax of XML, such as <v:shape/> and <v:path/>, and is compatible with HTML. A Web page encoded in VML can be displayed on the Microsoft Internet Explorer without installing any plug-in software. Figure 1 shows a VML code that displays the vector graphics shown in Figure 2.
|
|
Figure 1: Sample VML code
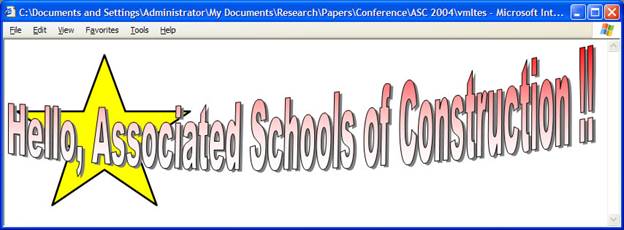
Figure 2: Sample vector graphics represented by VML
Scalable Vector Graphics (SVG)
SVG is another application of XML, designed for describing two-dimensional graphics in the Web page. It allows for three types of graphic objects: vector graphic shapes, images, and text. SVG graphics are scalable, so the same SVG graphic object can be displayed at different sizes on the Web page without sacrificing graphic resolution. In recent years, several researchers have built on this new way of representing vector graphics. Baravalle et al. (2003) demonstrated the use of SVG to produce a pictogram representation of numerical data obtained from scientific computer programs. Gonzalez and Dalal (2003) presented a web service that allows end users to specify a database query and visualize the extracted data as charts or graphs using SVG.
3D VML and 3D SVG
Although VML and SVG effectively deliver vector graphics and additional information to end users over the Internet, they are designed for displaying 2D vector graphics in the Web page. Gareth Richards (2000) (at gersolution.com) introduced a 3D VML library to display 3D vector graphics using VML. This 3D VML library is essentially a collection of JavaScript codes that creates a perspective view of the 3D model using 2D VML. Therefore, the speed of displaying the 3D SVG model depends on the computing power of the client computer. Lutz Tautenhahn (2002) later introduced SVG-VML-3D, which is essentially similar to the 3D VML library, for illustrating 3D vector graphics in the Web page using SVG or VML. Kang et al. (2003) modified the 3D VML library for architectural modeling. As shown in Figure 3, they tested the efficiency of the modified 3D VML library by creating an interactive 3D model of a university campus.
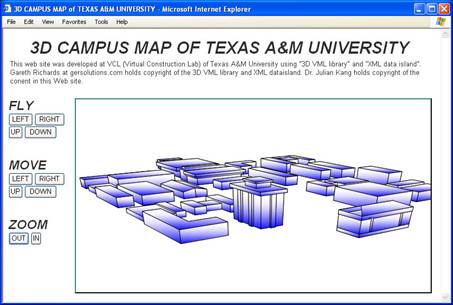
Figure 3: Interactive 3D VML model (Kang et al. 2003)
Development of a Web-based integrated design automation system
Our group
has developed a prototype Web application to facilitate the design automation of
box culverts using vector graphics technology. Design parameters are collected
via a series of Web pages as shown in Figure 4 and 5. An input text file for the
structure analysis is created from these design parameters in the Web server.
The server application then calls the commercial package and initiates the
analysis of the structure. After the structure analysis is finished, the server
application reads the output text file of the commercial package to extract the
maximum bending moment and maximum shear force. The bending moment diagram (BMD)
and shear force diagram (SFD) are then displayed graphically on the Web page
using VML as shown in Figure 6. Once the user provides additional design
parameters as shown in Figure 7, the server application selects the amount and
type of reinforcing steel bars needed to ensure structural stability. The
resultant design information is then saved in the database for succeeding
processes.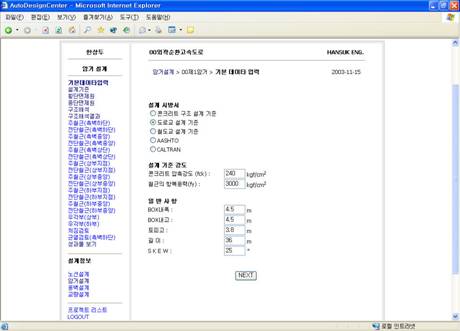
Figure 4: Web page for design parameter input
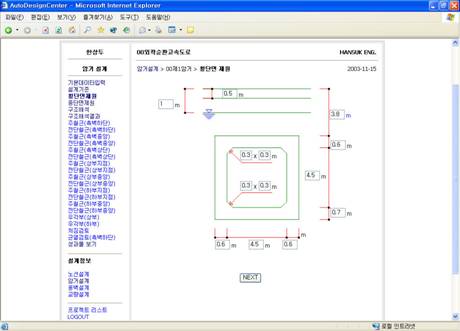
Figure 5: Design parameters depicted by VML
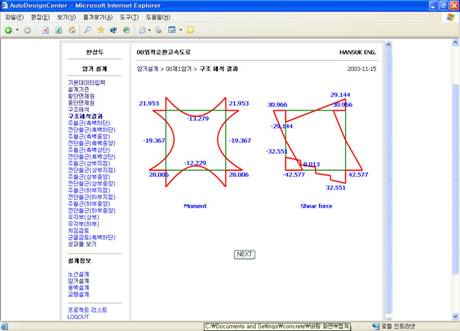
Figure 6: Bending moment diagram (BMD) and shear force diagram (SFD) illustrated by VML
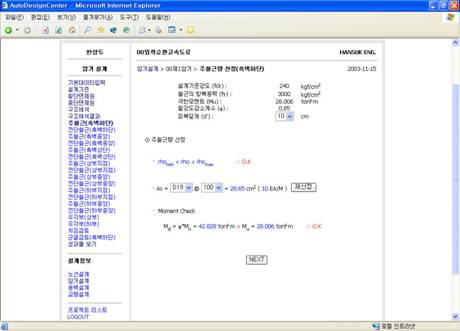
Figure 7: Web page for member selection
A design drawing is composed of several components such as floor plans, sections, and details. In order to allow users to modify the scale and location of these components in their drawings, we designed an XML data island. This XML data island defines the lines and text of each drawing component as shown in Figure 8. Each drawing component defined in the XML data island is stored in the database with associated project information. The modifiable information about scale and relative location of the drawing component is stored separately in the database. As shown in Figure 9, the full drawing is created with a collection of the XML data islands by a server application. The full drawing illustrated in XML is then transformed into a SVG document according to its XSLT configuration as shown in Figure 10.
|
<line> <s>blue</s> <sw>3</sw> <x1>123</x1><y1>15</y1> <x2>650</x2><y2>0</y2> </line>
{Repeat as many as the number of lines that compose the drawing component…}
<line> <s>blue</s> <sw>3</sw> <x1>650</x1><y1>0</y1> <x2>240</x2><y2>150</y2> </line> |
Figure 8: Definition of lines in the XML data island
|
<?xml version='1.0' encoding='ISO-8859-1'?> <drawing>
{The collection of XML data island to be included…}
</drawing> |
Figure 9: XML structure of the full drawing
|
<?xml version="1.0" encoding="utf-8" ?> <svg width="15in" height="15in" xmlns=http://www.w3.org/2000/svg xmlns:xlink="http://www.w3.org/1999/xlink"> <g style="stroke: blue; fill: none; stroke-width: 3" transform="translate(0 0) translate(0 460) scale(1) translate(0 -460)"> <a xlink:href="step6_input.asp?doID=317"> <line x1="0" y1="460" x2="800" y2="460" /> </a> </g> </svg> |
Figure 10: Sample SVG tag
To create the full drawing, the drawing components are positioned at the designated locations defined in the database. As a specific component in the full drawing is selected, an editable Web page where the user can update the scale and location information of the component is delivered. If the user provides new location information to the database in the server via the Web page, the server application updates the full drawing accordingly.
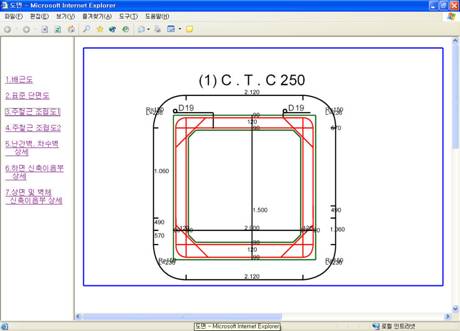
Once we had developed a pilot system, we designed a box culvert 5.6 m high to test the efficiency of the system. In the test, the entire design was finished less than 15 minutes, which indicated a potential time savings in the repetitive design of simple structures. Figure 11 shows one of the resultant drawings generated in the test.
|
|
|
Figure 11: Section drawing illustrated by SVG |
Conclusion
The Web-based integrated design automation system presented here has demonstrated how Vector Markup Language (VML) and Scalable Vector Graphics (SVG) facilitated the representation of vector graphics in the Web page. As demonstrated with the sample box culvert design, simple and repetitive structures can be designed in the Web page without running any structural analysis packages or CAD packages in the user’s computer. The only application required to implement the design process is a Web browser.
The system demonstrated here is also expected to improve the development of project legacy data. The resultant engineering documents and drawings can be collected in the Web server and shared with project participants via Web-based asynchronous communication. The public sector of the AEC industry should benefit especially from project legacy data stored in the Web server, by easy access to the right data to make proactive decisions for maintaining the constructed structures.
Acknowledgment
The development presented here was supported by the Ministry of Construction and Transportation in Korea (Grant No. 02 San-Hak-Yeon A01-07).
References
Baravalle A., Gribaudo M., Lanfranchi V. and Sandri T. (2003). Using SVG and XSLT for graphic representation. Proc., 2nd Annual Conference on Scalable Vector Graphics, Vancouver, Canada.
González G. and Dalal G. (2003). Generating SVG Graphs and Charts from Database Queries. Proc., 2nd Annual Conference on Scalable Vector Graphics, Vancouver, Canada.
Harrod G. (2003). aecXML & IFC. CADInfo.NET [WWW document] URL http:// www.cadinfo.net.
Kang J., Park J., & Lho B. (2003). Experimental Development of Web-based Building Information Model using 3D VML Library. Second International Conference on Construction in the 21st Century (CITC-II) “Sustainability and Innovation in Management and Technology” 10-12 December, 2003, Hong Kong.
Simmons C. and Rofail A. (2002). The Microsoft .NET Platform and Technologies. Prentice-Hall, Inc.
Richards, G. (2000). 3D Interactive VML. [WWW document] URL http:// www.gersolutions.com/vml.
Tautenhahn L. (2002). SVG-VML-3D 1.0. [WWW document] URL http:// home.t-online.de/home/lutz.tautenhahn/svgvml3d.
Teague T., Palmer M., and Jackson R. (2003). XML for Capital Facilities. Journal of Leadership and Management in Engineering, ASCE, 3 (2), 82-85.
Tserng H. and Lin W. (2003). Developing an electronic acquisition model for project scheduling using XML-based information standard. Automation in Construction, Elsevier B.V., 12 (1), 67-95.
Zhua Y. and Issab R. (2003). Viewer controllable visualization for construction document processing. Automation in Construction, Elsevier B.V., 12 (3), 255– 269.