|
(pressing HOME will start a new search)
|
|
The Secret Life of Spreadsheets: Dynamic Learning Tools for Construction
Michael
F. Hein and Scott Miller
Department
of Building Science
Auburn
University
Auburn,
Alabama
|
Spreadsheets have evolved into sophisticated computation and presentation tools, which are versatile, easy to use, and accessible. Modern spreadsheets hold tremendous potential as learning aids for education. This paper demonstrates the use of spreadsheets to supplement and enhance traditional teaching and learning methods of technical course material. The paper focuses on example spreadsheets, which have been integrated into structures courses of an undergraduate construction degree program. By using the seldom explored presentation and programming features available in contemporary spreadsheets, interactive teaching and learning devices have been produced. The appendix contains tips for designing effective spreadsheet presentations for education. Keywords:
Spreadsheets,
Spreadsheet Presentations, Multimedia Spreadsheets, Spreadsheet Macros,
Spreadsheet Programming. |
Introduction
The
spreadsheet is an ideal learning environment for technical topics, particularly
in courses with a heavy computational component. The cellular array of
information not only lends itself well to the statement and solution of
mathematically based problems, but also to the effective communication of both
problem and solution.
The
visual display of quantitative information made possible with current
spreadsheets, offers significant learning enhancements to students of technical
subjects. Modern spreadsheets contain powerful presentation capabilities, which
include formatting of text and cell regions, and the use of charts, graphic
objects, and animation effects. Today's spreadsheets can also easily import
objects from other application programs, such as sounds, digital photographs,
digital video and other multimedia effects. Using their native macro language,
combined with custom menus and dialog boxes, spreadsheets can be programmed to
function as highly automated interactive learning aids.
The
many features of spreadsheets can be combined in ways that produce meaningful
learning experiences for students of construction. For example, traditional
structural line models can be drawn and superimposed upon digital photographs of
building components. These visualization features can be further enhanced with
voice instruction and sound effects. The instructor can import sights and sounds
from the field into the spreadsheet where they provide a window into the
physical world being modeled by the computations. By blending the advanced
capabilities of modern spreadsheets, the construction educator can transform an
otherwise dry set of computations into an exciting teaching and learning
experience.
The
use of spreadsheets can create entirely new learning strategies for students and
teachers. What-if discussions, trend analyses, and approximation checks are all
valuable learning activities, which take more time than the traditional
technical problem solving approach permits. Taking advantage of the
computational power and speed of modern spreadsheets, instructors and students
can cycle through many problem scenarios, observing trends in the behavior of a
construction material or process, or a design or planning issue. Computational
time saved can be used for the valuable practice of approximation techniques to
verify reasonable accuracy of spreadsheet computations.
The
Spreadsheet in Education
Since
its introduction to the PC in 1979, the spreadsheet has become an indispensable
computational tool for countless applications in business, engineering,
construction and education. As a software application, the spreadsheet is
arguably as vital to the functioning of many businesses as the word processor.
Years after the introduction of estimating �specific software packages, the
spreadsheet remains one of the most commonly used software applications for
estimat�ing in construction offices.
The
versatility and reliability of the spreadsheet, the rapid improvement in its
features, its ease of use, and low price, are all ingredients to its success. It
is readily accessible and affordable to businesses, as well as to teachers and
students. More students are arriving in college classrooms with some exposure to
spreadsheets, and in some cases a significant proficiency with them. The
accessibility of the spreadsheet makes it a desirable tool for developing
teaching and learning applications.
Spreadsheets
have played an increasing role for both stu�dents and teachers outside the
classroom; however, the spreadsheet has been used very little to supplement or
enhance traditional teaching and learning within the class�room. For years,
instructors have been using the spread�sheet to perform the daily computations
that support their teaching efforts, such as producing grade sheets, budgets,
and calendars. Meanwhile, students have been taking computer courses that expose
them to spreadsheet applica�tions in business and construction. Recent advances
in the presentation capabilities of spreadsheets make them excel�lent teaching
and learning aids both in and out of the classrooms of computational based
courses.
Spreadsheets for learning Structures
Traditional
Structures
Structural
analysis is a discipline that has a strong basis in both computa�tions and in
graphics. Structures prob�lem statements are formulated visu�ally by sketching
a structural model and superimposing force vectors on the model. The force
vectors are char�acterized by magnitude, direction and point of application on
the structure. Solutions to structural problems in�volve applying simple
mathematical equations that describe the physical relationships of force and
stress. The connection between the visual models of the structure and the
mathematics used to describe them is essential to an understanding of structural
behav�ior. Modern spreadsheets contain capabilities that support both the
visual and computational components required for learning structures,
The
science of Structural Mechanics has remained rela�tively unchanged during the
past century; unfortunately, the methods developed to teach structural mechanics
have also remained static. A typical structures class consists of the time
honored and time consuming tradition of the instructor writing detailed problem
solutions on the board while students hurriedly copy the solutions into their
notebooks. Student effort outside class is concentrated on deciphering and
reviewing their notes. The learning process in the classroom is often suspended
while teacher and student occupy themselves with transcribing information. This
traditional classroom activity can discourage critical think�ing, and deprives
both student and teacher of engaging exchanges with each other about the
subject.
|
|
|
Figure
1. |
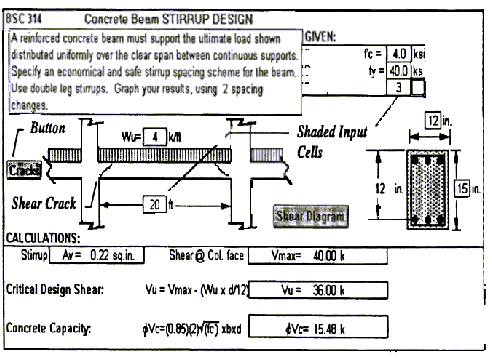
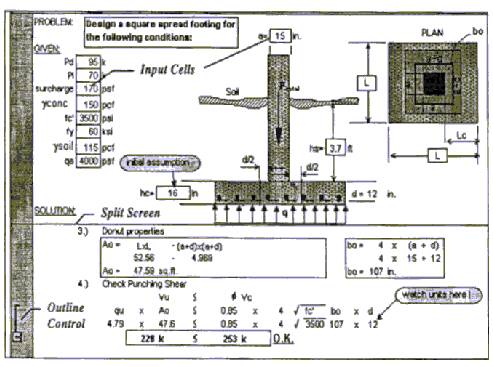
Spreadsheet Enhanced Teaching
An
alternate approach to teaching structural mechanics has been successfully
integrated into undergraduate structures at a major construction program. Figure
1 shows a portion of a spreadsheet developed to enhance the teaching of spread
footing design for a course in Reinforced Concrete. The spreadsheet is projected
directly from the instructor's com�puter onto a large screen in an
appropriately equipped classroom. To free student attention from transcription,
students are given a hard copy for taking additional notes. An electronic copy
of the spreadsheet is also made available for the student to review and practice
later. Notice that the spreadsheet supports the sketching, recording, annotating
and viewing of solutions one step at a time, just as in the traditional lecture
format. The split screen and outlining features allow the instructor to keep the
problem statement in view while revealing only those solution details necessary
for a meaningful discussion. The horizontal line beneath the sketch splits the
screen into two panes. The upper pane contains input cells for changing problem
parameters, along with annotated sketches of the elevation and plan of a spread
footing. The lower pane may be scrolled to display various portions of the
detailed solution. The control button at left bottom of the sheet, when pressed,
will hide the two bracketed steps of the solution outline.
There
are several benefits of a spreadsheet enhanced approach to teaching. Ideally,
time saved from tedious transcription frees the attention of both student and
teacher for the discussion of concepts, and exploration of alternate problem
scenarios, observation of trends, and the expansion of the discussion to related
topics. Time created is used to cover the same material with a higher degree of
quality, rather than to cram additional topics into the course. Outside the
classroom, the instructor uses the same spreadsheet to construct test and quiz
problems. Trial and error solutions are cycled through rapidly. Problem
statements containing given information along with spreadsheet drawings can be
easily cut and pasted to blank sheets or word processed documents. The student
can review the classroom material by changing input variables and observing
results. Homework assignments can be developed to encourage student use of the
spreadsheet. The same spreadsheet used for classroom presentation serves both
teacher and students outside the classroom.
Presentation
Tools
Formatting
Modern
spreadsheets contain outstanding presentation features, which rival their
computational capabilities. The Spreadsheet of Figure 2 was developed to
accompany the teaching of stirrup layout along a concrete beam. Note the use of
different text formatting including font types, sizes, boldfacing, and
underlining. When projected, the readability of this text far exceeds anything
that even the most gifted instructor can produce by hand on the classroom board.
Also notice that cell regions are independently formatted for emphasis by
assigning colors, patterns, and borders of many types. The shaded cells appear
on the spreadsheet as yellow regions with red text. This convention is used to
mark unprotected variable input cells, inviting the user to make changes in
these cells.
|
|
|
Figure
2. |
Grid
visibility, while great for tabular data, can be a distraction when using the
spreadsheet to display technical problem solutions. The clarity of the
spreadsheet solution above has been dramatically improved by turning the grid
visibility off.
Graphics
Spreadsheet
drawing features can produce surprisingly clear proportional drawings. The
beam/column profile and cross section (shown in Figure 2) were generated
entirely with standard spreadsheet drawing and editing tools. The sketch is
annotated with dimensions and notes that update whenever the input data changes.
Drawing annotations can be made visible or hidden, by assigning macro commands
to on-screen buttons. For example, to demonstrate the shear failure mechanism,
shear cracks appear on the beam profile when the Cracks button is pressed. By
using different drawing entities and varying their color, pattern, and line
weight attributes, highly readable drawings can be produced to illustrate the
computations. If more precise technical drawings are required, they can be
easily imported from and linked to other drawing applications, including CAD.
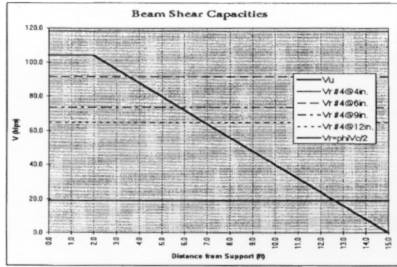
Charts
Spreadsheets
now contain a robust set of charting features. Many types of charts can be
easily produced from spreadsheet data. The Beam Shear Capacities diagram (see
Figure 3) is produced from a spreadsheet tabulation of shear values. Six
different line graphs have been incorporated from a single spreadsheet range,
which tabulates beam shear capacity verses distance from column support. The
table itself uses simple equations to generate the values from input data on the
Beam Stirrup Design spreadsheet shown in Figure 2. Changes in the input data are
automatically picked up in the table and forwarded to the graph of Figure 3.
|
|
|
Figure
3. |
Multimedia
Enhancements
Images
"A
picture is worth a thousand words" Spreadsheets now have the capability to
import images from any number of sources. Existing photos and slides can be
digitized using flatbed scanners, and slide and film
scanning
processes. Film scanning services, such as KODAK photo-CD can also be employed
to digitize preen fisting photos. Digital photograph can be taken with
inexpensive digital cameras and downloaded directly t the computer without the
use c film.
Images
are a rich source of vises information that can be shared among teachers and
students. Tradition, board drawings of structures use line sketches and symbolic
notations 1 represent structural components an connections. Students lacking
feel experience may not have access 1 mental pictures of the actual beam;
columns and framed connections the models symbolize. Furthermore, it is
extremely unlikely that all students have access to the same mental pictures
seen in the mind of the instructor.
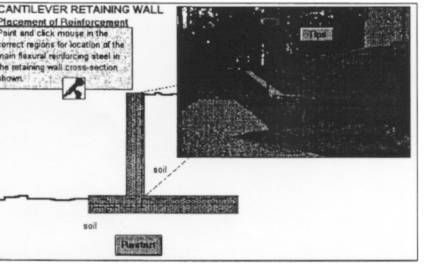
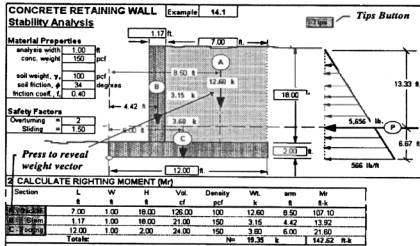
Images
from the field or laboratory bring glimpses of the world of construction into
the classroom where they can be shared by all. In Figure 4, a digital photograph
of a cantilever retaining wall has been imported into the spreadsheet and used
as a visual reference. By superimposing the retaining wall cross section on the
photographic image, vital visual connections can be made between the drawing
model and the actual structure it represents.
Sound
Sound
effects can be used in conjunction with images or animation to bring field
experiences closer to the classroom. For example, the image of a tower crane may
be accompanied by the sounds from the field of the crane's winch. Sounds may
also add emphasis to a text point, image, or animation. The ultimate strength
approach to the design of reinforced concrete components, is best understood by
visualizing potential failures in the components. The shear failure of the
concrete beam near the column (see Figure 2) is made much more memorable by the
sound of breaking glass that accompanies the animation of beam cracks. Sound
effects can be used as additional affirmation of a correct response, or to alert
the user to an input error or incorrect response. In the retaining wall
spreadsheet (see Figure 4), musical chords are played when the correct position
is selected for retaining wall reinforcement. If the wrong location of
reinforcement is selected, a spring sound accompanies the flexure of the
retaining wall (See Figure 5). This auditory cue captures the attention of a
student who may not have seen the initial visual cue.
|
|
|
Figure
4. |
Voice
messages providing instructions or tips can be played with the press of a
button. Voice messages are excellent for adding information that is required
infrequently, because they do not occupy precious visual real-estate on the
spreadsheet. When the microphone icon (see Figure 5) is pressed, the voice
message, shown in the text box, is played.
|
|
|
Figure
5. |
Animation
Visualizing
the potential motion of structural components when acted upon by forces is one
of the key devices to understanding the behavior of structures. Animating
structural models provides a new dimension to structural analysis, and greatly
enhances the explanation of structures concepts. Although animation tools are
not presently available in spreadsheets, primitive animation may be produced
through manipulating the visibility of drawing entities with the macro language.
The flexing of the retaining wall (shown in Figure 5) is accomplished by
revealing hidden line drawings. Animation created using animation software
packages may be played from within the spreadsheet through object linking and
embedding.
Digital Video
Another
link between the classroom and field is made with moving images. Video sequences
can be captured from videotape and played from within the spreadsheet. Video
showing the welding of a field connection, brings real world meaning to the
spreadsheet computations for moment resisting steel frames.
Spreadsheet Programming
Most
spreadsheet activities are earned out through an object oriented user interface.
Beneath this friendly interface is a programming language that governs the
activities of the spreadsheet. Occasionally it is efficient to group a sequence
of activities and store this grouping, called a Macro, for repeated use. To
accomplish this, the programming language must be accessed. Fortunately, modern
spreadsheets have macro recording capabilities, which automatically write the
programming code while the user performs a common sequence of activities. This
recording is stored separately and can be played back by the user. Viewing the
macro recording provides a glimpse into the programming language that directs
all spreadsheet activities. The macro shown at right, from the retaining wall
stability spreadsheet, brings the user to cell B89 on the Instructions sheet,
and then days a sound note embedded in that cell.
Buttons
Macros
may be quickly executed by assigning them to hawing objects on the spreadsheet.
The most common assignment is made to a button, which when pressed, runs he
macro recording. Button text labels are used to identify he macro activity. The
Reinforcement Tips macro, shown above, is assigned to the Tips button on the
Retaining Wall stability Analysis spreadsheet (see Figure 6). Pressing the Tips
button executes the macro. Pressing buttons A, B, or C in the calculation table
reveals a corresponding weight rector with updating annotations. A macro that
hides the vector group is assigned to the group itself; so that selecting any
element in the group will hide the information again. These reveal and hide
macros facilitate the clear visualization of computational elements, which is so
important to the understanding of structural stability of the retaining wall.
|
|
|
Figure
6. |

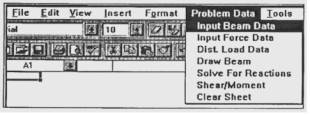
Pull Down Menus
Custom
pull-down menus, like buttons, can be created to provide convenient and easy
activation of macros. These menus are similar to file cabinet drawers in that
they organize links to similar tasks in one common location. The spreadsheet
menu in Figure 7 contains a custom pull down menu labeled Problem Data. This
menu provides interactive functions for constructing two dimensional structural
beam models. Selecting one of the menu items activates a macro linked to that
particular item. For example, selecting the menu item Input Beam Data launches a
macro that creates a dialog box for the user to input and store beam parameters.
Other menu items prompt the user for additional input data, or execute programs
that draw the beam, solve for reactions, or graph shear and moment diagrams.
Unlike buttons, which compete with other data for space on the spreadsheet, pull
down menus are opened by the user only when necessary. Since pull down menus are
sheet independent, they are particularly useful for creating information on new
spreadsheets.
|
|
|
Figure
7. |
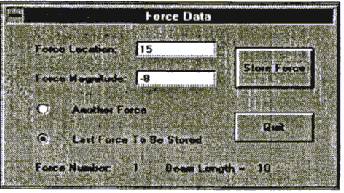
Dialog Boxes
Spreadsheets
contain the capability to hold an interactive dialog with the user. Dialog boxes
may be created to query the user for specific input. The Force Data dialog box
(shown in Figure 8) requests input about force location and magnitude. The box
also displays other pertinent information; such as the force number and beam
length.
|
|
|
Figure
8. |
A
dialog box stays hidden until requested by the user, thus allowing the sheets to
remain uncluttered by displaying selected information rather than columns of
data. The sheet on which the programmer creates the dialog box can also be
hidden and protected to ensure that inadvertent changes do not occur.
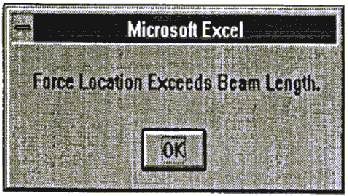
Programming
filtering loops allow the data to be verified before being stored. If
unacceptable or incorrect data is input, message boxes can be generated which
prompt the user for correct data. The entry for the location of the force in the
above illustration is greater than the length of the beam, if the user attempts
to store this data the following message box appears. (See Figure 9)
|
|
|
Figure
9. |
Advanced Techniques
A
deeper understanding of the programming language can produce highly automated
spreadsheet functions. Programming loops can be written which allow the computer
rather than the user to accomplish many repetitive tasks. For example, once
input from the dialog boxes were stored as variables, the beam case shown at
right (see Figure 10) was generated by selecting the Draw Beam menu item. As the
macro is running, loops are used to place the different drawing objects on the
screen at different locations specified in previously stored variables. The same
program uses a multiplication variable to ensure that all objects are drawn to
scale. Since the spreadsheet program can quickly produce a clear and accurate,
scaled representation of the problem, the instructor can rapidly address unique
problems posed during class. The time saved from transcribing the diagram can be
used by the instructor to explain the concepts demonstrated in the example. The
spreadsheets can also be saved for quick retrieval in subsequent lectures, and
to produce hard copies for students.
|
|
|
Figure
10. |
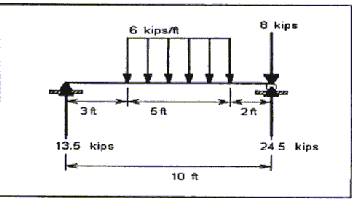
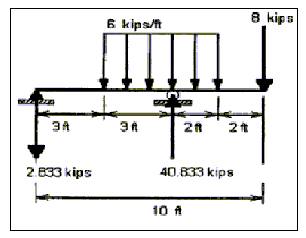
The
creation of a spreadsheet program also allows the user to easily generate a
database of examples from which a study guide or lecture note packet can be
easily prepared. The storage of a series of problems, generated by the program
as a variable is changed, can allow the trend in a system to be illustrated. In
the example above (Figure 10), as the roller support is shifted to the left, the
corresponding change in reaction forces is easily observed (see Figure 11).
Programming not only allows the instructor to efficiently use classroom time but
also allows efficient use of office hours, since test questions and solution
keys can also be quickly generated. Finally and most importantly, making the
program available to students, encourages them to learn by exploring on their
own. The time spent using the program to explore problems they create, or to
examine what-if scenarios posed by the instructor, can lead students to a better
understanding of the concepts involved in the problems.
|
|
|
Figure
11. |
Investment Versus Return
The
development of effective spreadsheets for learning requires a substantial
investment of energy by the instructor. A single multimedia spreadsheet may
require up to eight hours of initial time to develop, and an additional hour of
tune-up each time the spreadsheet is used in the classroom. This time depends
upon the familiarity of the instructor with the spreadsheet features.
Programming features require additional time to develop, test, and debug the
code. Fortunately, this investment is not without rewards for both teacher and
students. First, the same spreadsheet can serve the multiple functions of
classroom presentation tool, student practice and learning device, and problem
and solution generator for homework and tests. Once created, the spreadsheets
are easily altered for improvements, or copied and adapted to different
purposes. Second, the spreadsheets can create new teaching strategies for
instructors and new learning opportunities for students. Finally, the process
can be energizing for the instructor, who is discovering new ways of presenting
old ideas. Enthusiasm is a great ally for the teacher; it is communicated to
students as surely as is course content. Ideas that have become too familiar
lose the luster they had when first discovered. By continuing to seek ways to
renew learning for themselves, great teachers stay in touch with the learning
process and communicate a love for learning to their students. This process can
be sparked through the examination of new teaching methodologies and
instructional technologies such as the ones discussed in this paper.
Conclusion
Spreadsheets
contain seldom used tools, which can enhance and supplement traditional methods
of teaching and learning. Their versatility, interactivity, accessibility, and
ease of use make them ideal platforms for creating learning modules for
technically based courses. They contain the capabilities for traditional
classroom computation and drawing, but at a far greater degree of accuracy,
reliability, and presentation quality. In addition, their speed at repetitive
tasks, and their programmability, make new learning strategies possible. The
spreadsheets take time for an instructor to develop, but with many benefits in
return. By freeing the instructor and student from tedious computation and
transcription, they create opportunities for meaningful understanding of
technical material. A well-designed spreadsheet can engage both student and
teacher, inviting their exploration and discovery of the subject, drawing them
deeper into the secrets that it holds.
References
Sullivan,
D.R, Lewis, Cook, Computing Today, Houghton Mifflin Co., Boston, 1988
Dodge,
Mark, C. Kinata, C. Stinson, Running Excel 5 For Windows, The Cobb Group, 1994
Orvis,
William J., Visual Basicfor Applications, Que Corp., 1994
Appendix A
TIPS
FOR EFFECTIVE SPREADSHEET
PRESENTATIONS
FOR EDUCATION
Spreadsheet
Design
-
Develop a simple and consistent style.
-
Use color, font, borders and patterns to assign relative
importance
to different data types.
-
Avoid too many color, font, border, or pattern changes.
-
Use split screen feature to freeze a pane for input data
and
sketches at top of the spreadsheet.
-
Clearly identify input and output regions of the spread�
sheet.
-
Identify given, required and solution information on
the
spreadsheet.
-
Use labeled drawings to illustrate computations.
-
Learn to use special drawing features that allow for locking onto cells,
orthographic drawing and moving, and grouping drawing objects.
-
Use text boxes linked to cells for automatic updating of
dimensions
and other annotations.
-
Make sure smallest data is readable in back of room. (20
pt
font minimum for 640x480 resolution).
-
Protect spreadsheet areas (formula, titles, instructions,
macro
module sheets) against accidental changes.
Maximize
viewing area by suppressing menus, toolbars, column and row headers, etc.
Eliminate
grid lines for clarity.
Experiment
with different effects - e.g., images, sound and animation.
Spreadsheet
Presentation
Practice
before entering the classroom.
Make
sure hardware is set up and working properly before class period begins.
Hand
out hard copy of a sample solution if possible.
Engage
students through what-if scenarios - observe results.
Assign
homework that requires student to use the spreadsheet to discover.
Encourage
students to construct their own spreadsheet solutions.
Don't
abandon other proven effective teaching techniques - i.e., live demonstrations,
experiments, discussions, etc.
Slow
down. Spreadsheet contains a lot of information; it should be unfolded slowly to
students. Before jumping into solution, orient student to each new spreadsheet,
pointing out various areas, guiding them over the landscape.
Use
mouse as pointing device. Avoid tendency to point to screen -you may end up
blocking the view!
Learning
Environment
All
students should be able to see and hear the presentation.
Appropriate
low level lighting should be available for note-taking.
Room
must contain appropriate environmental controls that the instructor can access
and use easily.
Teaching
podium should contain easy access to various media devices.