(pressing HOME will start a new search)
![]()
![]()
- ASC Proceedings of the 25th Annual Conference
- University of Nebraska-Lincoln- Lincoln, Nebraska
- April 1989 pp 74-83
|
(pressing HOME will start a new search)
|
|
REDUCING CONSTRUCTION-RELATED INJURIES AND THEIR COSTS
|
Hank Mol and Steve Williams Auburn University Auburn,
Alabama |
| In
the spring of 1988, the Department of Building Science at Auburn
University received a grant from several construction companies in the
SouthŁeast to do research in construction
safety. The grant was given to develop and analyze a computerized
database of information on construcŁtion related injuries in 1987
provided by four relatively large Alabama construction companies. From the resulting database of
nearly 600 accidents and more than 10,000 individual data, the frequency
and severity of accidents were related to such parameters as age of
workers, craft, time of day, day of week, accident cause, body part,
type of injury, and insurance costs. The construcŁtion tasks and
environmental conditions on which corrective measures are likely to
yield the highest return on investment as well as specific
recommendations for reducing severity and frequency of accidents are
presented. KEYWORDS: Construction,
Safety, Database, Accidents, Injuries, Workmen's Compensation. |
INTRODUCTION
It
can be argued that construction companies have a moral obligation as well as a
legal responsibility to provide a safe working environment for their employees.
However, even if these issues are not considered, simple economics dictate that
careful and continuous consideration be given to construction safety.
Accidents
cost the construction industry over 9 billon dollars every year [1]. Workmen's
compensation insurance rates have increased dramatically in the past few years,
and evidence indicates that this trend toward increasing rates will continue and
very likely accelerate [2].
There
is a direct and substantial monetary gain that can be realized by reducing the
number and severity of construction accidents. Ideally, corrective actions
should be directed so that they yield the highest benefit to cost ratio.
Unfortunately, many contractors are not aware of the specific areas where their
safety performance could and/or should be improved. The focus of this study was
to analyze existing accident data, identify specific problem areas, and make
recommendations that will likely yield a high return on investment.
ECONOMIC
IMPACT OF ACCIDENTS
The
economic impact of accidents can best be discussed by way of a short example. Suppose a contractor has an annual volume
of 100 million dollars, which would have placed the contractor 220th on the 1988
Enqineerinq News Record top 400 list. Suppose further that the annual
payroll is 10% of this figure, and that the average base rate for workmen's
compensation is also 10% of annual payroll. The annual cost of workmen's
compensation would then be calculated as noted.
Hypothetical
Construction Company
Annual Volume=$100,000,000
Payroll=10% of Annual Volume
Workmen's Compensation Rate=10% of Payroll
Annual
Cost of Workmen's Compensation
($100,000,000) (10%) (10%) $1,000,000
The
base rate for workmen's compensation insurance is modified by what is called an
experience modification rating (EMR). This rating is based on company safety
performance over the past three years. EMR's typically range from 0.5 to 2.0.
For the hypothetical case discussed previously, variation in the EMR from 0.5 to 2.0 would result in annual premiums of either
$500,000 or $2,000,000 as noted.
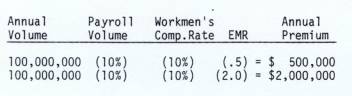
In
other words, the difference in insurance premium cost for a very poor safety
record versus an excellent one for this hypothetical company is $1,500,000. The
cost of accidents is not just a fixed cost of doing business. It is
a cost over which management has a great deal of control.
INDIRECT
COSTS OF ACCIDENTS
In
fact, the costs described above are just a percentage of the true cost of
accidents. There are indirect costs associated with every accident that occurs
on a construction site. A few examples of these indirect costs are listed below.
|
These
items represent just a few of the many factors that are seldom accounted for
when the cost of an accident is determined. They are often subjective in
nature and difficult to calculate but are nonetheless very real costs that
must be paid by the contractor. Because these expenses are usually hidden in
total labor costs, management does not get an accurate picture of the true
economic damage caused by job-site accidents. Safety experts conclude that it is
conservative to estimate the indirect costs of an accident to be 4 times the
insurance company direct costs. They may be as high as 17 times the insurance
costs [3].
EFFECT
OF ACCIDENT
FREQUENCY ON INSURANCE PREMIUMS
Two
primary factors should be considered when looking at the history of a company's
accidents. These factors are frequency and severity. There is a tendency to
incorrectly assume that accidents which incur only minor costs are unimportant.
When
experience modification ratings are calculated, the frequency of accident
occurrence is much more important
than the severity of the accident [4]. Minor accidents have a major impact on
the amount of money a contractor must pay for workmen's compensation insurance.
RESEARCH
PROCEDURE
Four
large general contractors agreed to supply all relevant safety records for the
1987 calendar
year.
They also agreed to provide corresponding insurance costs wherever possible.
Each of the four companies has an annual volume that places them in the Engineering
News Record top 400 list, and is engaged
primarily in the construction of buildings.
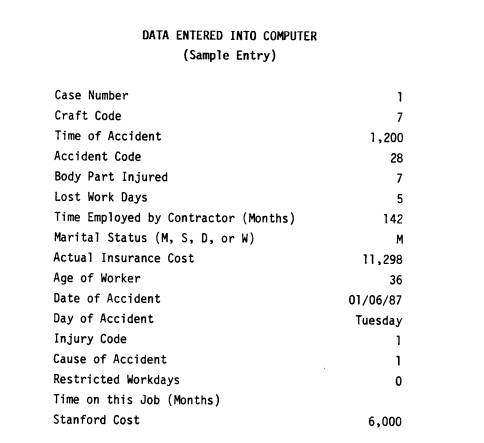
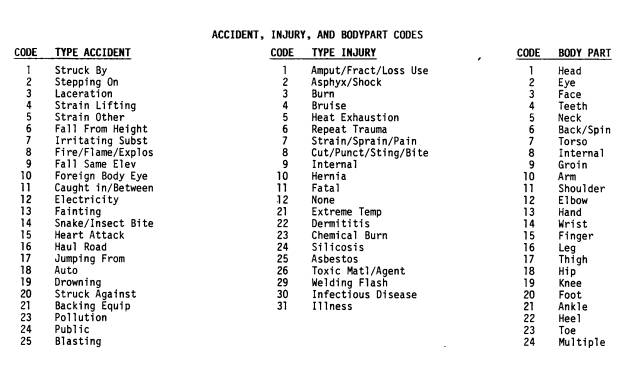
Each
accident report form was analysed in detail
and broken down into 17 different categories. These categories included such
items as age of worker, type of craft, day of week, cause of accident, body part
injured, and insurance cost (see appendix charts Al and A2). A total of 594
accident report forms were catalogued in this
fashion.
After
the forms were analyzed, the more than 10,000 individual data were entered into
a customized computerized database that was developed specifically for this
project.
The
data entry phase was followed by a period of verifying and checking to ensure
that no input errors had been made.
Once
the data were entered and verified, an . extensive and comprehensive analysis
was performed. The data were collated and categorized in a myriad of different
ways. Results of this work will be explained in
the section that follows.
DISCUSSION
ON FINDINGS
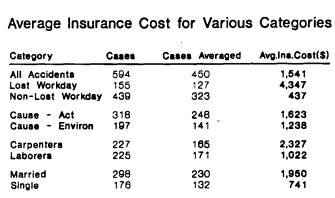
Average Insurance Cost
Average
insurance cost was determined considering only those cases for which insurance
costs were available. Most cases were closed. If they were not, the insurance
reserve was added to the cost paid to date.
Analysis
of the research data indicated that the average direct cost paid by the
insurance companies for each injured employee was $1,541. If the employee's
injury resulted in lost or restricted workdays, the average direct cost was
$4,347 (Chart 1). Considering that approximately 35 percent of the insurance
company's premium revenue goes toward their profit and general overhead costs,
the construction contractor's workman's compensation insurance premium cost is
about 1.54 times the direct cost paid by the insurance company for injuries.
This does not consider the impact of the EMR. As stated previously, the
construction contractor may also have indirect costs for accidents that are 4 to
17 times the insurance company direct costs [3].
 |
| Chart
1 |
The
average cost of injuries caused by employee acts was found to be 30 percent
higher than
for
injuries caused by the employee's environment. Considering also that 62 percent
of the injuries were caused by employee acts, it is this area that should
receive emphasis for corrective action.
The
average cost of injuries to carpenters was $2,327, which was more than twice the
$1,022 average cost for laborers. This difference nay be caused in part by the
fact that carpenters normally earn higher salaries than laborers. The average
cost for other crafts was not deterŁmined because of insufficient sample size.
Married
employees had an average cost per injury of $1,950, which was more than 2.5
times higher than the $741 average cost for single employee. This somewhat
surprising statistic may be partially the result of single employees being
generally younger and less skilled, hence having a lower wage rate.
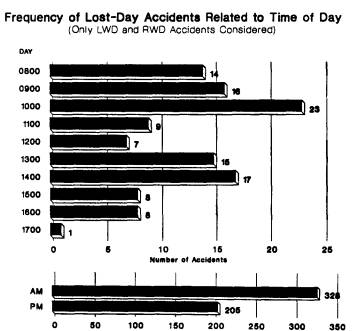
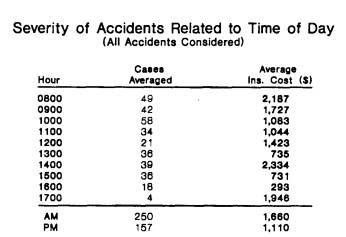
Time
of Day
When
all accidents were considered, the data indicated that most accidents occurred
at 10
M,
perhaps because the job's production intensity is greatest at mid-morning. The
data also showed that there were about 60 percent more accidents in the morning
than in the afternoon (Chart 2).
 |
| Chart
2 |
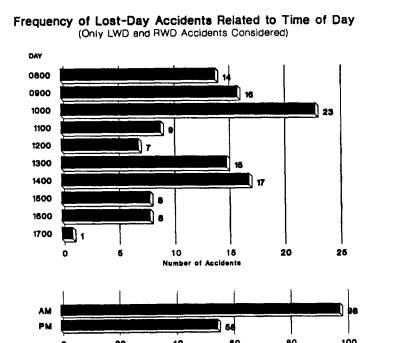
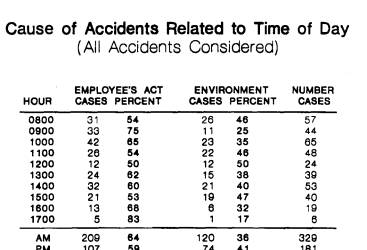
Analysis
of accidents which resulted in lost or restricted workdays showed the same trend
(Chart 3). It is interesting to note that the data does not support the common
notion that accidents occur at the start and ending of the workday. The
percentage of accidents caused by an employee's act increased slightly at
mid-morning and again late in the day (Chart 4). The average insurance cost per
injury was 50 percent higher in the morning than the afternoon, which suggests
that the more serious accidents occur in the morning (Chart 5).
 |
| Chart
3 |
 |
| Chart
4 |
 |
| Chart
5 |
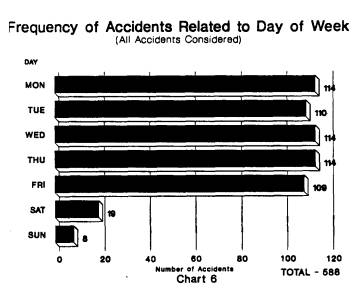
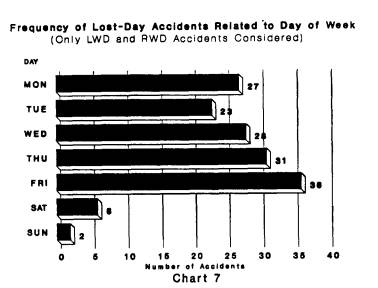
Day of Week
Accidents
occurred with approximately the same frequency for each day of the week (Chart
6),
but
there was a trend for more lost or restricted workday accidents to occur on
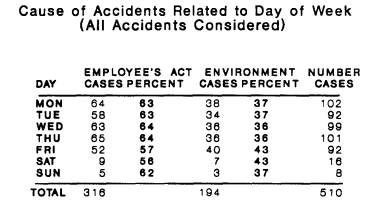
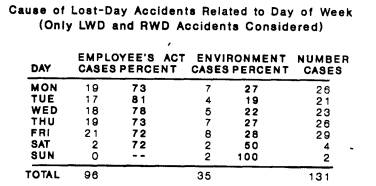
Friday (Chart 7). Approximately 60 percent of the accidents were caused by an
employee's act regardless,of the day of week (Chart 8). However, employee's acts
caused over 70 percent of the lost-day accidents, while again showing no
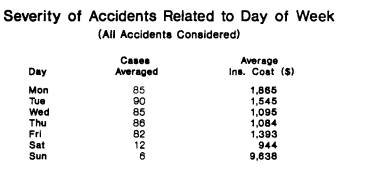
significant difference between the days of the week (Chart 9). The average
insurance cost paid per injury was highest on Monday at $1,865, decreased as the
week progressed, and then rose on Friday to $1,393 (Chart 10).
 |
| Chart
6 |
 |
| Chart
7 |
 |
| Chart
8 |
 |
| Chart
9 |
 |
| Chart
10 |
Employee
Age
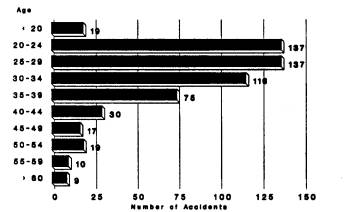
The
number of accidents was determined for various age groups, but without knowing
the age mix in the workforce, the frequency or propensity for accidents in any
group could not be determined (Chart 11). Research by others has shown that
worker's age has no relation to incidence of injuries [5].
| Frequency
of Accidents Related to Age of Worker (All Accidents Considered)
|
| Chart
11 |
The
severity of accidents relative to age group, when measured by average insurance
cost paid per injury, increased with age to age-group 30 to 34 (Chart 12). The
increase in cost is influenced by the likely increase in workmen's compensation
benefits generally paid to older workers due to their higher skill and wage
rates. The relatively small sample sizes below age 20 and after age 34 precluded
reliable results for those age groups.
|
|||||||||||||||||||||||||||||||||||||||
| Chart
12 |
|||||||||||||||||||||||||||||||||||||||
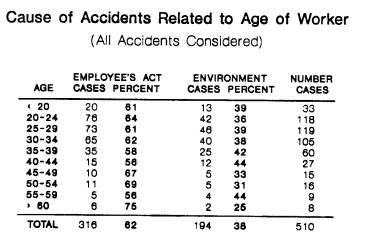
The
cause of accidents, act versus environment, showed no significant difference
between age groups. The total sample showed that 62 percent of the accidents
were caused by employee acts (Chart 13).
 |
| Chart 13 |
Time
Employed and Time on Job
The
number of accidents decreased as time on the job and time employed by the
contractor increased (Charts 14 and 15). Although it may be that workers new to
the job or new to the employer are more likely to have accidents, the data could
not be used to support that conclusion because the mix of the workforce relative
to time employed and time on the job was not known. Other research has shown
that frequency of job-related injuries is directly related to employee turnover
[6].
|
|||||||||||||||||||||||||||||||||||||||||||||||||||||||
|
Chart
14 |
|||||||||||||||||||||||||||||||||||||||||||||||||||||||
|
||||||||||||||||||||||||||||||||||||||||||||||||||
|
Chart
15 |
||||||||||||||||||||||||||||||||||||||||||||||||||
The
data did not show a relationship between average cost of accidents and time on
the job or
time employed, possibly because of inadequate sample size. This was caused in
part by these data not being provided in some of the accident reports or by
having to discard time on the job
for some cases where it was obviously entered erroneously in the accident
report. The data did show that there was no relationship between cause of
accident, act versus environment, and time
on the job or time employed by the contractor.
Marital
Status
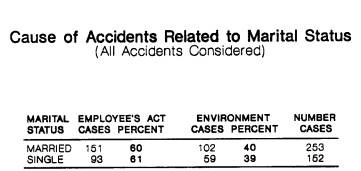
The
marital status of the injured employees was recorded, but the propensity for
accidents for married versus single could not be determined without the mix of
married and single in the workforce. However, other research has shown that
frequency of injuries is not related to marital status [5]. It was found that
the cause of accidents was about the same for married and single employees, 60
percent acts and 40 percent environment (Chart 16).
 |
| Chart
16 |
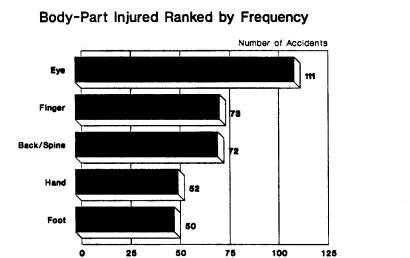
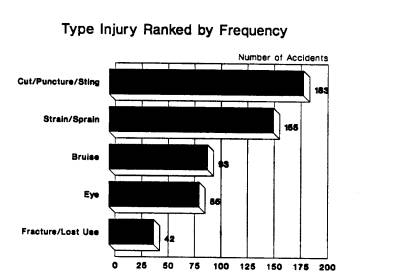
Most
Frequent Accidents
The
most frequently occurring accidents, bodyŁparts injured, and type injuries are
shown in charts 17 to 19. Frequency of accidents and injuries, regardless of
average cost, is an important consideration when determining priorŁities for
corrective action to lower insurance cost because of its impact on premium
rates. As stated previously, the experience rating plan for workman's
compensation insurance preŁmiums gives greater weight to accident frequency
than to accident severity.
 |
| Chart
17 |
 |
| Chart
18 |
 |
| Chart
19 |
After
examining the more frequent accidents, it became apparent that some of the
categories, such as accidents where an employee was struck by an object or where
injuries resulted in cuts, puncture, sting or bite, were too broad to focus on a
particular corrective action without further category breakdown. However, the
category "foreign body in the eye" has a relatively high frequency, 89
cases out of the 594 total cases, and is sufficiently specific to allow focus on
a correcŁtive action. Other categories of this type are strains due to lifting,
48 cases; cut fingers and hands, 49 cases; and foot punctures, 29 cases.
Increased
emphasis on proper lifting technique would certainly lower the back-strain cases
which are 70 percent of the strains due to lifting. The wearing of proper eye
protection, gloves, and steel-soled shoes would considerably lower injuries to
the eyes, hands, and feet, possibly by as much as 50 percent. When examining
lacerated hands alone, it was estimated that 70 percent of those injuries would
have been reduced or eliminated by wearing gloves. All of the foot punctures
would probably have been eliminated by the wearing of steel-soled shoes.
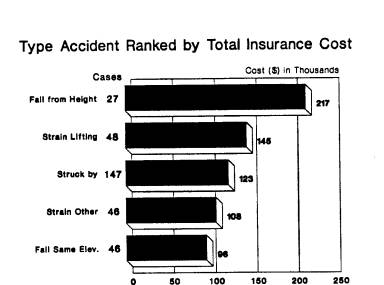
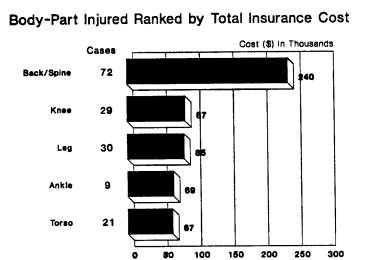
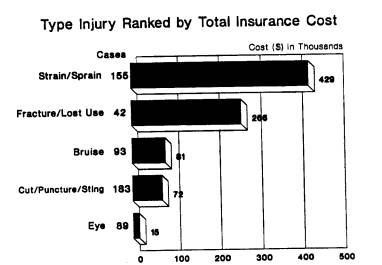
Most Costly Accidents
The
most costly accidents, body-parts injured, and type injuries, as determined by
multiplying number of cases by average direct insurance cost per case in each
category, are shown in charts 20 to 22. Since the ranking by total insurance
cost considers both frequency and severity, it too is a good indicator for deterŁmining
priorities for corrective action.
 |
| Chart
20 |
 |
| Chart
21 |
 |
| Chart
22 |
Falls
from height were found to be the most costly type accident. Thirty-one percent
were from scaffolds, often improperly secured. Wet or muddy conditions caused 25
percent of the falls at the same elevation. The diversity of causes suggest only
that workers be trained to be more aware of their environment, and that foremen
pay more attention to providing a safe working environment.
STANFORD
ACCIDENT COST ACCOUNTING SYSTEM
Each
accident was analyzed to determine an estimated cost using the Stanford Cost
Accounting System [7] and entered into the computer for comparison with
insurance company direct costs. It was hoped that a correlation would be found
which would allow modification of the Stanford Cost Schedule to account for
inflation and allow a recommendation for its use as a predictor of accident
costs. However, a correlation was not found, probably because the data base was
too small. Nevertheless, construction companies should look for ways in which
the cost of accidents might be considered in determining the profitability of
individual jobs and in rating the performance of job superintendents.
INCIDENCE RATES
National
and state averages are published which list the frequency of OSHA reportable
injuries and illnesses and on the frequency of those cases with lost or
restricted workdays. The incidence rate for OSHA reportable cases in
non-residential building construction in Alabama for 1985 was 21.0 cases per 100
full-time employees [8]. The incidence rate for lost and restricted workdays (LWD/RWD)
in Alabama that year for the same workforce was 7.6 cases. Contractors should
compare their company's incidence rate with the state and national rates, but
they should also recognize that different contractors interpret what is an OSHA
reportable case in different ways. This will influence the company's
incidence
rate. The incidence rates calculated for the four construction companies using
the data provided were as follows:
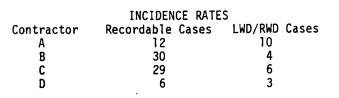
Are
these incidence rates good for comparison of the company's accident experience
with state or national rates? Probably not. Contractor A's LWD/RWD incidence
rate indicates a high accident rate, but the recordable case incidence rate
shows an excellent record. It is possible that contractor A did not interpret
many of the minor recordable cases as being recordable. Contractors B and C have
good lost workday rates but poor recordable case incidence rates. It is likely
that they recorded cases that need not have been recorded. Contractor D has such
excellent incidence rates for both categories, that they are questionable. It
could be that the reported manhours were more than the work activity for which
accidents were considered.
COMPANY
SAFETY PROGRAMS
Since
formal safety programs have been credited with helping lower injury rates in
construction [9], the written safety programs for each of the four companies
submitting accident data were requested for review. Only one of the four
submittals was considered a comprehensive company safety program. One of the
companies submitted a job safety plan similar to that required on Corps of
Engineers contracts, one submitted an excellent safety booklet provided to their
craftsmen, and one submitted the AGC manuals on accident prevention and OSHA
compliance. Although the latter three submittals represented excellent aspects
of a company safety program, they were not in themselves sufficient in providing
a comprehensive company safety program.
The
most important action that a construction company can take to reduce accidents
is to establish a policy that makes the safety of its employees as important, if
not more important, than production. This policy should be in writing, signed by
the CEO, and communicated to all personnel with the understanding that
compliance is a condition of employment.
For
a large company, a comprehensive safety program should include written
descriptions of the responsiŁbilities of all personnel as they relate to
safety, a project safety requirements planning checklist, employee safety
procedures and requirements, safety inspection and accident/incident
investigation checkŁlists and procedures, accident emergency proceŁdures,
accident/illness reporting and recordkeeping procedures, employee craft skills
and safety training, safety motivation program, and subconŁtractor safety
requirements. A study in 1980 indicated that the cost of administering a
construction safety program amounts to about 2.5% of direct labor cost. The
ratio of savings to the costs of administering the program was found to be 3.2
to 1 [3].
A
vital aspect of a construction company's safety program is the analysis of
safety hazards found on inspections and investigations, and follow-up to insure
that corrective action has been taken. A systematic approach is
necessary
to be effective and will show management's true commitment to safety. The
National Safety Council has published an excellent booklet describing a
relatively new and detailed approach to correction of hazards [10].
RECOMMENDATIONS
Wear
Eye Protection
Many
companies involved in manufacturing require that safety glasses be worn by
employees when they are in or near the process areas, essentially eliminating
eye injuries. Yet, for some reason, few workers in the construction industry are
required to wear eye protection.
Eye
injuries comprised 19% of all the accidents that were logged. Most of these
accidents were avoidable. Although the average cost for these injuries was
relatively low, a company's experience modification rating (EMR) is more closely
tied to the frequency of accidents rather than severity. Therefore, the true
cost of these accidents is considerably higher than the average cost of $173 per
case.
Require
Proper Hand and Foot Protection
We
recorded a large number of lacerations and puncture wounds to hands and feet.
Many of these accidents could have been avoided by wearing gloves and/or safety
boots with steel toes and steel soles. Although some may argue that gloves may
be cumbersome when working at some tasks, their use would greatly decrease
injuries to the hand and should be considered. There is no justification for not
wearing safety shoes.
Use
Proper Lifting Procedures
Among
the most costly accidents are those involving back injuries when lifting. All
superintendents should be aware of proper lifting techniques and should educate
workers on proper lifting techniques through toolbox meetings or other training
methods. While these accidents can never be eliminated, their frequency can be
reduced with a proper educational program.
Be
Aware of Environment
A
suprisingly large number of accidents occurred because a worker slipped on a
slick surface. Muddy, oily, or slick surfaces should serve as a red flag to
superintendents, and workers should be cautioned accordingly.
Establish
a Comprehensive Safety Program
Beyond
the moral and legal responsibilities that a construction company has for the
safety of its employees, economic interests dictate the desirability of a
comprehensive safety program. All large construction companies should establish
a written comprehensive company safety program to include:
|
Keep Better Records
While
gathering data from the accident report forms, we were hampered by the
inconsistancy between forms from different states, the sometimes inadequate
description of the cause of the accident and the extent of the injury, and
occasionally the incomplete or erroneous entries in the forms. If company
executives are to achieve an effective safety program, they must be able to
monitor the type and frequency of accidents that are occurring. Project
superintendents should be required to fill out a detailed form in addition to
the required OSHA or insurance form. Upon reaching the main office, the data
from these forms should be stored in a computerized database, so that they might
be organized and categorized for further analysis.
Include Safety Performance in Evaluatinq Superintendents and Job Profitability
Since
the safety record of a company affects its profitability, and since personnel
are often provided bonuses based on their contribution to profitability, it is
recommended that some measure of the cost of accidents be considered in
evaluated performance. One such method might be to use the direct cost paid by
the insurance company plus any reserve set aside for accidents occurring on a
project. The true cost of the accidents may be considerably higher than this
cost. Some of the cost is already charged to the job in lost productivity,
rework, and overhead charges, and some of the cost will show up on future jobs
in the form of higher insurance premium cost. However, much may be gained by
drawing attention to the economic aspect of safety.
ACKNOWLEDGEMENTS
The
authors wish to extend sincere gratitude to Mr. Steve Belflower, student
research assisŁtant, for the excellent job he did in assisting with the
gathering and analysis of data for this report. In addition, we wish to thank
industry members Jim Rein, Robin Savage, Jim Gorrie, and Ben Nevins for
providing their time and the mass of information upon which this report is
based.
Lastly,
a very special thank you to Mrs. Jane Parrotte for her endless patience and her
excellent advice regarding the preparation of
this document. She is a unique and invaluable asset to the Department of
Building Science.
REFERENCES
1.
The Business Roundtable, Improving Construction Safety Performance,
200 Park Avenue, New York, N.Y., January 1982.
2.
"Premiums Pulse Upward for Workers' CompensaŁtion," ENR,
September 15, 1988, p. 58.
3.
"Improving Safety Helps Improve the Bottom Line," Civil Engineering,
ASCE, October, 1982, p. 48.
4.
National Council on Compensation Insurance, An In-depth View of Experience
Rating, One Penn Plaza, New York, N.Y., 1982.
5.
Hinze, J., "Human Aspects of Construction Safety," Journal of
the Construction Division, ASCE, Vol. 107, No. COI, March, 1981, p. 63.
6.
Hinze, J., "Turnover, New Workers, and Safety," Journal of the
Construction Division, ASCE, Vol. 104, No. C04, December, 1978, p. 412.
7.
Levitt, Raymond E. and Samelson, Nancy M., Construction Safety Management,
McGraw-Hill, New York, N.Y., 1987, p. 30.
8.
Alabama Department of Labor, Alabama OccupaŁtional Injuries and
Illnesses Survey 1985, 64 North Union Street, Montgomery, Alabama.
9.
Hinze, J. and Harrison, C., "Safety Programs in Large Construction
Firms," Journal of the Construction Division, ASCE,
Vol. 107, No. C03, September, 1981, p. 464.
10.
National Safety Council, Accident InvestigaŁtion ...A New Approach,
444 North Michigan Avenue, Chicago, Illinois, 1983.