(pressing HOME will start a new search)
![]()
![]()
- ASC Proceedings of the 25th Annual Conference
- University of Nebraska-Lincoln- Lincoln, Nebraska
- April 1989 pp 39-43
|
(pressing HOME will start a new search)
|
|
AN EXAMINATION OF MEASURING AND REPORTING WORK PROGRESS
|
Neil N. Eldin |
Robert
K Hughes |
| A number of approaches for measuring and reporting work progress is currently being used in the construction industry, but each has certain features that detract from its effectiveness. These detracting features involve the basis on which we measure work progress and the level at which we integrate cost and scheduling data. This paper examines the current approaches to measuring and reporting work progress and identifies major problems in their implementation. The paper also promotes the search for an alternative approach that may prove more advantageous. |
INTRODUCTION
Construction
is the largest industry in the United States. It accounts for twelve percent of
the gross national product, employs approximately five million Americans, and
involves an annual expenditure of almost four hundred billion dollars [1].
Studies have shown that more than ten percent of the construction enterprises in
the United States fail annually due to poorly informed management and
ineffective use of management tools [2].
Although
the need to minimize potential failure in the construction industry has provided
the impetus for the accelerated growth of project management techniques, major
challenges in tracking construction projects still exist. This paper briefly
describes the current practice in measuring and reporting work progress, and
discusses some problems in implementing the current approach. It also suggests
an alternative approach that seems to have the potential for resolving such
problems.
CURRENT MANAGEMENT APPROACH
The
primary purpose of a project control system is to provide management with the
information necessary for decision making. To prove successful time management
of a project, the current practice often focuses on one date, the completion
date of the project. Similarly, it focuses on one cost figure, the total project
budget, as proof of successful cost management. Since these two performance
measures are certain only at the completion of the project, attempts are made to
determine the project's progress and to predict its performance at intermediate
stages. In doing so, management faces two major challenges: 1) measuring work
progress; and 2) integrating cost with scheduling data.
Measuring Work Progress
Two
basic requirements need to be established at the start of a construction project
to enable the quantitative measurement of work progress. These are: 1)
Definition of the level of detail at which progress will be measured; and 2)
Selection of the basis for progress evaluation.
Definition
of the Level of Detail - The work breakdown structure (WBS) is the current
management tool for defining the lowest level of detail at which progress will
be measured on a construction project. The WBS is a concept by which work items
are grouped to establish meaningful relationships among the different levels of
control on the project hierarchy, such as shown in Figure 1. In this manner a
project management team (PMT) can specify the level of detail for the tracking
system adopted. The work items shown on a WBS represent the lowest level of
detail at which project records are kept on a project.
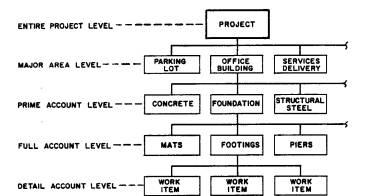 |
| FIG.
1 - Levels of Control on Work Breakdown Structure |
Selection
of Basis for Progress Evaluation - Review of the attempts to quantify work
progress reveals that three bases for progress measurement have been used: 1)
project's expenditures; 2) installed quantities; and 3) earned value.
The
principal assumption in using project's expenditures as a progress measurement
tool is that the ratio of the project's cost-to-date to its total estimated cost
is indicative of the project's progress (percent of completion). It is quite
apparent that a substantial amount of the project's funds can be expended
without any significant progress being realized. This shortcoming directed
attention to the fact that assessment of work progress should be based on actual
quantities installed rather than merely actual expenditures.
Measuring
progress based on quantities installed appeared promising at first. However, the
use of different units of measurement (i.e., pounds, cubic yards, tons, feet,
etc.) was a major obstacle in the application of this method. The different
units did not allow the summation of the progress achieved on subcomponents to
determine the progress of a work item. To determine the project's overall
progress, the summation of progress achieved on different work items was not
possible without assigning weight factors to each item and using the weighted
percent complete (WPC) method [3]. The WPC method entails lengthy and cumbersome
calculations that limits its effectiveness.
It
was also realized that although the quantity of concrete placed on the first
floor of a skyscraper is equal to that placed on the top floor of the same
building, the cost and time for placing each of these two identical work items
are significantly different. Pipe work, structural steel, and piling are other
examples of work items for which the unit cost and unit time vary significantly
based on elevation, size, diameter, and metallurgy, among other factors. For
such items reporting quantity installed could be misleading unless these other
qualifications are known.
All
these difficulties in measuring work progress, whether based on the project's
expenditures or installed quantities, led into the development of the earned
value concept. The earned value is the amount budgeted or planned to reach a
specific goal regardless of the actual expenditures incurred in reaching that
goal. Implementation of this concept is accomplished by identifying
distinguishable events (control points) throughout the life cycle of the work
items and by developing earning rules for reaching these events. The control
points for a work item such as placement of a footing foundation may include
excavation, forming, steel reinforcement, placing concrete, and backfilling. The
earning rules assign a value to each control point. The earning values can be
expressed as percentages of the item's budget, duration, or an arbitrary work
unit.
The
status of each work item is determined by determining whether or not the control
points were accomplished. The work item earns the full percentage assigned to a
control point only when it is completed, but partial credit may also be allowed
if appropriate. The work progress (percentage of completion) and the earned
value for a work item are determined by the following Equations:
![]() Equ.1
Equ.1
![]() Equ. 2
Equ. 2
Where:
(PC) is the percent complete for the work item under consideration, (CPi) is the
earning percentage associated with control point number i, and (Ai) is the
actual progress accomplished on control point number is expressed in percent.
To
determine the progress at a higher level on a WBS, for example, the entire
foundation, one adds the earned value of all footings and divides that total by
the total budget for the entire foundation. This computation is expressed by the
following Equation:
![]() Equ. 3
Equ. 3
It
should be noted that Equation 3, which is another form of Equation 2, is
applicable at all levels of control on the WBS.
Cost
and Scheduling Integration
The
WBS is also considered the key to the integration of cost and scheduling data
[4].
This integration can be achieved by developing a WBS in which the work items represent scheduling activities, and by assigning a unique cost code to each level of control on the WBS. By doing so, costs of each scheduling activity can be tracked for control purposes, and integration of cost and scheduling can be achieved.
PROBLEMS IN CURRENT APPROACH
Although
the two management challenges may appear to be well under control, in reality
they are not. Hidden problems still exist which limit the application of the
various concepts presented. These problems involve both the level at which
cost-scheduling data are integrated and the basis for progress measurement.
Level of Cost-Scheduling Integration
If
a work item on the WBS presents a typical scheduling activity (e.g., place draft
fan foundation, erect retaining walls, etc.), it may not satisfy the
requirements for being a typical cost item. Cost items in a project budget are
not activity oriented. Unlike the scheduling activities, cost items (e.g., site
work, concrete, finishes, equipment, etc.) and their cost codes are material or
craft oriented. It is the common practice that budgets follow the estimates'
format, and cost estimates are not usually structured around a WBS. Estimates
customarily follow the Construction Specifications Institute (CSI) MASTERFORMAT
or a similar format. Cost records, therefore, are not usually available at the
level of detail appropriate for full integration with scheduling activities.
To
further illustrate, a scheduling activity (e.g., placing a footing foundation)
involves several subactivities (e.g., excavation, formwork, reinforcement steel,
concrete work, hardware, installation, and backfilling operations). Each
subactivity belongs to a different cost item. The cost of each subactivity is
only a small component of a major cost item, for which cost records are not
readily available.
Although
theoretically nothing prevents us from keeping costs at any level of detail,
practically costs are not kept at the subactivity level. An attempt to keep cost
records at the subactivity level will result in creating an unmanageable cost
system and imposing unnecessary extra work on the material handling system.
Basis for Progress Measurements
With
the above in mind, a question arises on whether progress should be based on
cost, time, or other basis. In other words, when a project is reported 70%
complete, does this mean that 70% of the budget was rightfully earned, the
project will be completed after a duration equal to 30% of its planned duration,
or 70% of the quantities were placed ? Another question then becomes obvious:
what are the relationships between the percent complete, budget, and duration of
a construction project ?
The
progress status of an activity and likewise of a project may vary significantly
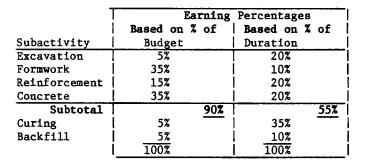
depending on the basis for measurements. Table 1 illustrates numerically the
variance in work progress for a footing foundation reported on different basis.
Assuming
that work was completed on the first four subactivities at the time of update,
the reported progress could then be equal to either 90% if progress is based on
cost or only 55% if based on time.
| TABLE
1. Reported Progress of a Work Item |
 |
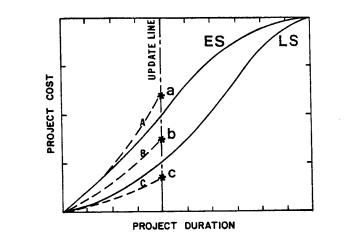 |
| FIG.
2 - Time-Cost Envelope Diagram |
Further
analysis of the three possible actual performance curves suggests that none of
these interpretations is conclusive and each could be misleading. Points 'a',
'b', and 'c' could each depict a poor performance or an excellent performance.
Point 'a', for example, may indicate cost overrun, but it could also indicate
excellent performance resulting from accomplishing more work than scheduled; or
it could reflect early arrival of either material or equipment for which cost
was reported earlier than anticipated. Similarly, point 'c' may indicate slow
progress which is reflected by a cost underrun situation, or it may mean
excellent performance resulting from getting work accomplished under budgeted
cost. Conversely, point 'b', the supposedly desired and acceptable performance,
may in reality be the result of poor performance if it meant the same progress
represented by curve 'C' but achieved at a higher cost.
In
recognition of these shortcomings and in an attempt to improve this widely used
management tool, a modification was recently proposed in 1986 (5].
The
modification recommended plotting the project's cost profile and the project's
accomplishments curve on the same graph in a manner similar to that shown in
Figure 3.
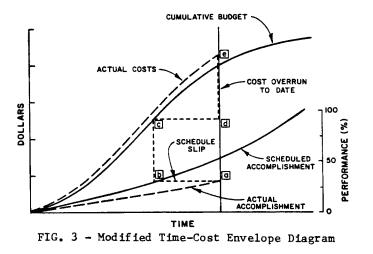 |
| FIG
3. Modified Time-Cost Envelope Diagram |
Assuming
that work was completed on the first four subactivities at the time of update,
the reported progress could then be equal to either 90% if progress is based on
cost or only 55% if based on time.
PROBLEMS IN REPORTING PROGRESS
The
time-cost envelope diagram is one of the most popular reports to describe the
progress of a construction project. This diagram is a graphical representation
of cost profiles based on early start (ES) and late start (LS) schedules, as
shown by the solid curves in Figure 2. As a project progresses, actual project
costs are plotted on the graph as indicated by the dashed curves. When a project
is represented by a curve similar to curve 'B', i.e., falling inside the planned
cost envelope, the progress of the project is judged to be satisfactory. If the
actual costs are described by curves similar to 'A' or 'C', outside the planned
cost envelope, the progress of the project is judged to be unsatisfactory. Curve
'A' is interpreted as an indication of an overrun situation, while curve 'C' is
interpreted as an indication of a behind schedule situation.
To
determine scheduling performance in this method, one projects point (a) of the
Actual Accomplishment curve onto the Scheduled Accomplishment curve (point b).
If this requires going back on the time scale, the project is behind schedule.
The expected delay is equal to the distance between point (a) and point (b) on
the time scale. In arriving at point (b) if it is required to advance ahead of
the update time, the project is ahead of schedule. The scheduling gain is equal
to the distance between point (a) and point (b) on the time scale.
A
cost overrun situation is detected by comparing the cost corresponding to the
level of accomplishments projected on the Cumulative Budget curve (point c) and
the actual cumulative cost at the time of the project's update (point e). If the
actual cost expenditure (point e) is greater than the planned cost (point c), an
overrun situation is detected. The magnitude of such a cost overrun is equal to
the difference between the two points (c and e) on the cost scale. Similarly, if
the actual cost expenditure is less than the planned cost, an under run
situation is detected. The magnitude of a such cost under run is equal to the
difference between the two points (d and e) on the cost scale.
Although
this modification offers an improvement to a widely used reporting method,
certain shortcomings remain. The modified approach still erroneously assumes
that a sound quantitative method exists for measuring work progress upon which
the performance curve is generated.
PROPOSED APPROACH
The
problems discussed above are perhaps a result of the current management approach
which in essence attempts to use one indicator in describing the performance of
an entire project. In effect, each point on the Cost-Time diagram is attempting
to describe performance in terms of cost, schedule, and completion
simultaneously. The inadequacy of this approach prompted the authors to search
for an alternative in which more than one indicator are used simultaneously to
describe the different aspects of progress, an alternative that is not based on
full cost-scheduling integration.
It
was interesting to notice the similarities and differences between how
construction projects are managed and how financial analysts manage business
enterprises. Financial analysts have been successful in evaluating companies'
performance and identifying problem areas using financial ratios. With this
technique, ratios describing the relationships among different items on the
balance sheet and profit and loss statements are used as indicators of the
overall performance of a firm. The emphasis is placed on understanding that none
of the ratios individually is a good indicator of a firm's performance, rather,
the value and correlation of many ratios collectively determine the business
performance [6,7]. Instead of searching for one indicator to describe the
success of the entire business, up to fifty different ratios are generated to
evaluate each aspect that affects the overall performance.
Another
important concept in this technique is the use of ratios of data elements
instead of the absolute values of such data. The use of ratios was found to
eliminate problems in comparing companies of different sizes or in different
locations. Also, the use of ratios expedited the analysis, reduced the large
numbers of items to a relatively small set of readily comprehensive and
economically meaningful indicators, and minimized the problems of time lag in
reporting costs [8,9].
Developing
a progress evaluation technique for construction projects which is analogous to
the financial ratios analysis technique is an alternative that deserves further
investigation. The development should address: 1) identifying project ratios
capable of describing the different aspects of work progress; 2) developing a
procedure to detect work items with potential problems; and 3) devising an
analytical algorithm to calculate the monetary impact on the final project cost.
CONCLUSION
Examination
of the current approach for progress evaluation indicated that major
implementation problems exist. Namely, these problems are in determining the
basis for progress measurements and the practicality and the degree of
cost-scheduling integration. This may result in generating misleading
information such as that reported by Time-Cost diagrams.
It
is suggested that a different approach to measuring and reporting work progress
is needed. Development of a methodology analogous to the financial ratio
analysis method which has been used in evaluating the performance of businesses
appears to be a promising alternative.
APPENDIX 1.-REFERENCES
|