(pressing HOME will start a new search)
![]()
![]()
- ASC Proceedings of the 24th Annual Conference
- California Polytechnic State University - San Luis Obispo, California
- April 1988 pp 76-82
|
(pressing HOME will start a new search)
|
|
IMPACT
OF LATE DELIVERIES ON CONSTRUCTION PRODUCTIVITY
|
David
A. Marchman |
IMPACT
OF LATE DELIVERIES ON CONSTRUCTION PRODUCTIVITY
Schedule changes have a dramatic impact on construction productivity. The work, when originally planned and estimated is organized according to an orderly flow of manpower, materials and subcon�tractors using a logical sequence of work activities. When this orderly plan is impacted by a schedule change such as late deliveries of equipment, labor productivity can be severely effected due to a number of factors. First, since the contractor's job in most cases has a fixed-end date, he is forced to work outside the normal logical flow of activity sequencing. The rhythm of the project is affected and more fragmenta�tion of work activities results. There is no chance to take advantage of the normal learning curve. The contractor never reaches the full level of productivity that could have been achieved without the impact.
Secondly, the reassignment of personnel to available work usually causes a density problem where the work is available. That work had been laid out in a logical manner and was probably already manned at a reasonable level. But, to achieve percentage completion the contractor is forced to work in a non-optimum situation and productivity is affected.
Third, more conflicts between and among crafts and subcontractors result when forced to work outside of proper sequencing. Interferences with the orderly flow of scaffolding and increased rework has an extensive impact. These factors and their results have been documented in numerous studies and claims over the years. The purpose of this paper is to document the actual impact of the late delivery of several pieces of major equipment on a particular project.
This particular case involved a contract to furnish six almost identical modules to the north slope of Alaska for a gas processing unit. The modules were to be fabricated in Portland, Oregon, and then barged to their final location. The client was to furnish all major equip�ment, and a schedule of delivery dates with the bid package. These documents were the basis for the original plan, schedule, and estimate. The contract limited the schedule to seventeen weeks, with a severe liquidated damages clause for late mechanical completion. The competitive lump sum nature of the contract forced the contractor to use standard estimating productivity rates to establish man-hour requirements. Then the fact that the modules were almost identical could be taken into consideration. The classical productivity improvement due to the learning curve should' have provided a definite man-hour savings on this project.
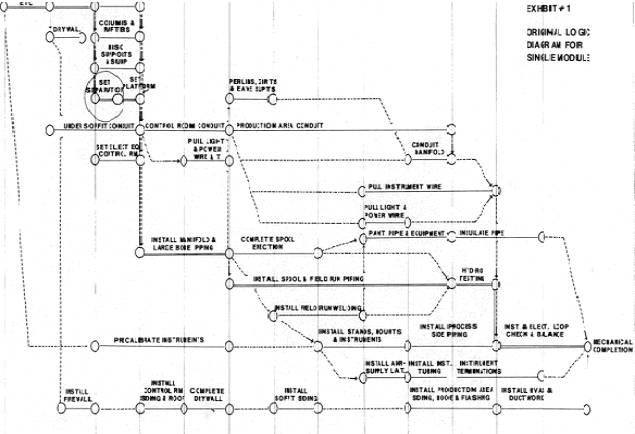
The original estimate for the modules was 102,468 man-hours. The final man-hour projection when this study was prepared (approximate 60% completion) was 117,903 (a growth of 15,435 man�hours or 15.1%). Exhibit #1 is a copy of the original schedule. A large separator was to be installed on each module that was an intregal part of the work flow of the module. The separator had to be set before major piping, electrical and instrumentation activities could be started. The modules were walled-in structures, with wasted space held to a minimum. If an intregal part of the major equipment was missing, all work in the path of placing the equipment was delayed. The delay of the separators had an impact on the logical sequencing of the construction activities. The double lined activities on Exhibit #1, document that the installation of the separators is on the critical path of work activities.
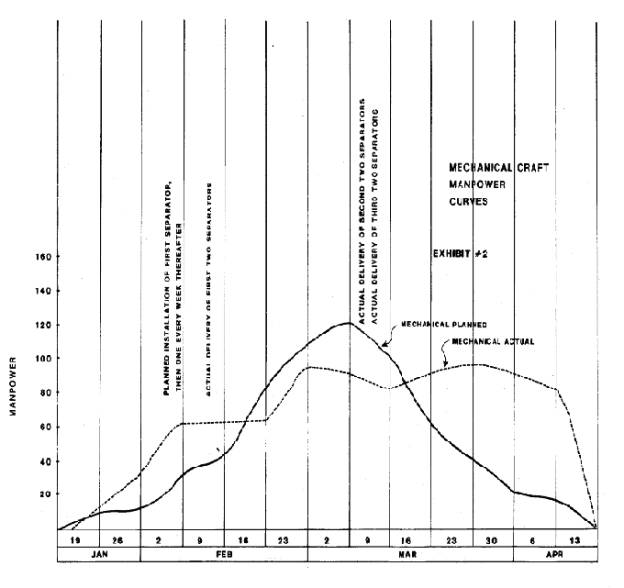
Exhibits #2 and #3 are used to document the actual schedule impact of the separator delays in terms of the original planned manpower buildup and reduction. The source documents for these exhibits were the craft manpower profile charts as presented to the client in the bid package, the weekly labor reports to document actual man�hours by craft discipline, and the weekly progress report for quantities installed. The exhibits are based on equivalent 40 hour weeks with only direct man-hours plotted and no change order man-hours taken into consideration. The shape of the curve also reflects overtime man-hours that were spent to maintain the schedule.
Exhibit #2 is used to document the actual expenditure versus the planned manpower requirements for the mechanical portion of the work. In an effort to get ahead of schedule, up until the week ending February 2nd, the contractor had built-up manpower faster than the planned curve. The work during this period was well organized and good progress was being made. Then, from the week ending February 2nd until the week ending March 23rd, the unorganized and uneven expenditure of man-hours reflects the scheduling impact of the separator schedule delays. Of even greater significance in this time period, is the fact that the percent complete was not sufficiently gained for the number of man-hours expended. For the period ending March 23rd to April 6th; the actual manpower curve starts to decline, but manpower is still higher than originally anticipated. Not only was work shifted to later dates, but the area under the actual manpower curve is greater than that under the planned manpower curve. Due to loss of productivity, more man-hours had to be spent to get back on schedule. There are three reasons for the loss in productivity. One, having to perform work outside of the planned, efficient progression of the work. Two, increased manpower to make up for lower productivity and lost time compounds the loss since more people have to work in a tightly confined work area. Third, the increase of overtime to make up for lost time and lost productivity also compounds the lost productivity problem and increases the unit labor costs.
Exhibit #3 documents the actual manpower versus the planned manpower for the Instrumentation and Electrical disciplines. From the beginning of the project until the week ending February 9th, the contractor expended man-hours at approximately the same rate as the originally planned burn rate. During the period from February 9th to March 9th, the actual manpower curve is substantially above the planned curve. Again, the reason for the problem is the separators. The contractor was forced out of an orderly sequence of work, and was trying to gain percent complete by moving as much of the originally planned later work to an earlier time period as possible. This was the only way to maintain the overall project schedule. From the period March 9th to April 6th, the actual manpower curve is lower than the planned curve, but this is misleading. The reason is that due to the scheduling impact, the other craft disciplines were peaking in this time frame, and forcing more of the electrical and instrumentation manpower requirements toward the end of the project.
Through the ripple effect, all craft disciplines were impacted due to the separator delays. Not meeting this critical path milestone completely changed the momentum of the project. From a project with an orderly buildup and established learning curve, it was changed into a position of false starts and being in a catch up mode.
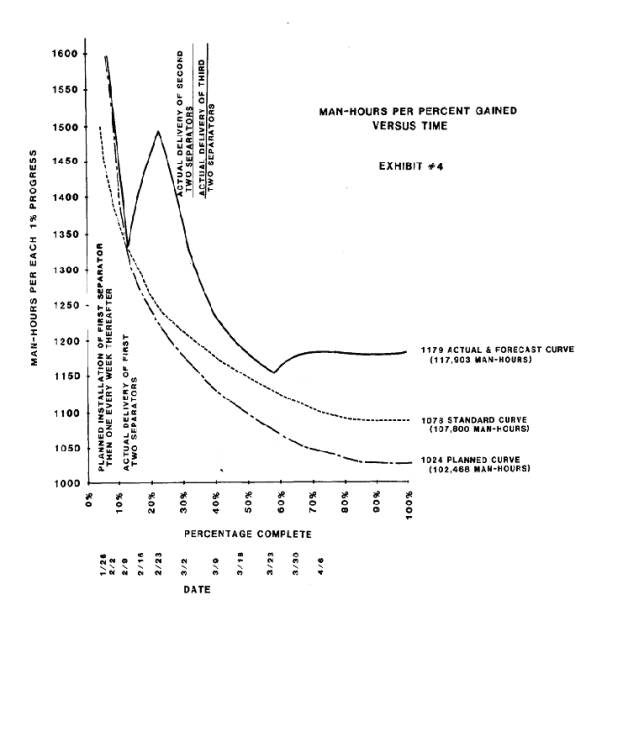
Exhibit #4 is a plot of "Man-Hours Per Percent Gained Versus Time" for the module fabrication project. This table depicts direct man-hours only, and excludes change orders. The exhibit is a plot of three curves. The "Standard Curve" was based upon standard estimating productivity rates. The shape of the curve is an interpolation, based upon the shape of slopes from comparable projects.
The second curve is the "Planned Curve". This curve is consistent with the detailed schedule and original forecast of 102,468 man-hours. The difference between the standard curve of 107,800 man-hours and the planned curve of 102,468 man-hours is 5,332 man-hours. This difference is attributed to the fact that the contractor built a learning curve into its budget and therefore, would have expected the "Planned Curve" to come below the "Standard Curve". At the 12% range, a drastic deviation was experienced on the project, which caused the anticipated savings not to come to fruition. The anticipated 5,332 man-hour savings due to the increased efficiencies of the contractor's original plan of attack was not unrealistic. Due to the scheduling impact, the contractor was not able to take advantage of the savings that should have resulted from the learning curve.
The final of the three curves is the plot of the "Actual and Forecast Curve". This curve is an actual historical plot through the week ending April 6th, and a forecast through the end of the project. It results in a projection of 1,179 man-hours per 1% gained. As can be seen from Exhibit #4, the contractor was ready to set all separators on the week ending February 2nd. The approximate one week delay in the installation of the first two separators did not unduly impact the overall man-hours for each 1% gained. But, on the week ending February 9th, the residual effects of scheduling uncertainties and the above stated problems had a drastic impact on the man-hours expended for each 1% gained. The rate went from approximately 1,325 at 12 complete to 1,475 at 22 complete.
During this time the contractor should have been getting more efficient. From the 22% (February 23rd) to the 58% complete (March 23rd) range, the slope started coming back down, but, the damage had already been done. The project duration was not long enough for the curve to come back down to the standard range (1,078 man-hours per 1% gained). From 58% (March 23rd) to the 73% (April 6th) range, there is another hump in the "Actual and Forecast Curve". This is due to the impact of premium time to try to maintain the overall schedule.
The difference between the "Actual and Forecast Curve" is 15,435 (or a 15.06%) growth). This difference is directly attributable to the contractor's not being able to execute the project in an organized, orderly, logical and workmanlike manner.
This project was estimated and scheduled according to a reasonable, attainable plan for pursuing the work. The plan was being carried out and everything was tracking as anticipated until the late delivery of the separators. There were no other external or management variables that affect this project other than the separator deliveries. This 15.06% growth in the number of man-hours required to complete the project is substantial but not nearly as great as other documented cases of schedule driven impacts on productivity. Schedule changes have a dramatic impact on construction productivity.
REFERENCES
|
Construction Claims Monthly, "How Schedule Changes Affect Construction Costs - The NECA/MCAA Study", Volume 4, Number 8 August 1982. |
|
|
|
|
|
|