-
ASC Proceedings of the 42nd Annual Conference
-
Colorado State University Fort Collins, Colorado
-
April 20 - 22, 2006
|
|
|
Comparison of Gantt Chart Scheduling Method and Linear Scheduling Method in Scheduling Multiple Utility Line Construction Project
|
Aiyin Jiang, Ph.D. 2220 Victory Parkway College of Applied Science University of Cincinnati Department of Construction Science Cincinnati, OH 45206 |
Bin Cheng, MS M.E. Rinker, Sr. School of Building Construction University of Florida Gainesville, FL 32611 |
|
Although popular scheduling methods, such as Gantt chart and its variation (linked Gantt chart) and Critical Path Method (CPM), are really beneficial to the construction industry, these methods are still criticized while applied to scheduling linear construction projects. Linear scheduling method is beneficial to linear construction in its presentation on productivity and project progress corresponding to true location. This paper presents a case study which describes the scheduling process of underground utility project and compares the Gantt Chart method with linear scheduling mehtod in scheduling utility project. It indicates that Gantt chart method is short in providing information such as productivity and true project progress location. It also indicates that current linear scheduling studies focus on the balanced productivities of activities of a linear project, the method has not studied the scheduling problems on several utility lines. Multiple utility lines intersect with each other at some locations as designed. Each line at the intersected location has its own elevation. Crews are assigned to work on each line. These crews may arrive in the intersected location simultaneously which cause work space conflicts. The paper identifies the limitations of both methods in scheduling multiple utility line construction projects, and further research are addressed in scheduling method - identifying the interference locations, predicting the interference time, and how to avoid the work space conflicts to keep the crew work continuously.
Key Words: Multiple Utility Lines, Linear Construction Project, Gantt Chart, Linear Scheduling |
It is not unusual for utility contractors to construct multiple utility lines with several crews working simultaneously. Although popular scheduling methods, such as Gantt chart with Critical Path Method (CPM), is really beneficial to the construction industry, it is still criticized while applied to scheduling linear construction projects. Linear scheduling method is beneficial to linear construction in its presentation on productivity and project progress corresponding to true location. However it is not addressing the scheduling in multiple utility lines. Multiple utility lines intersect with each other at some locations as designed. Each line at the intersected location has its own elevation. Crews are assigned to work on each line. These crews may arrive in the intersected location simultaneously which cause work space conflicts. The following will present the process of the construction scheduling of HCC utility construction company, compare both scheduling methods in scheduling multiple utility line, describe the problems that are faced by HCC utility construction company, identify limitation of both methods, and further research area is addressed.
HCC is one of the largest utility contractors in the North Florida area. It was founded in 1974. The company’s participation in both the public and private sectors and its diverse mix of project types and sizes have contributed to the Company's revenue growth and profitability. The business expanding brings challenges of construction management to HCC, especially in planning and scheduling stage. The construction management personnel tries to avoid work space conflicts and time of rework, improve its crew productivity, to maximize its profit. The company applies several popular planning and scheduling methods to solve the challenges from scheduling. These methods include linked bar chart and line of balance method. In order to describe the application and limitation of these scheduling methods, the following sections would first introduce the planning and scheduling procedure of HCC and then compare the applications of these methods.
Construction Operation of HCC
Usually HCC splits an awarded contract into its several parts: sanitary sewer system, storm drainage system, potable water system, fire and irrigation system, power sleeve line, and gas line. HCC has several types of crews to perform these separated jobs. Each type of crew has expertise experience on its work.
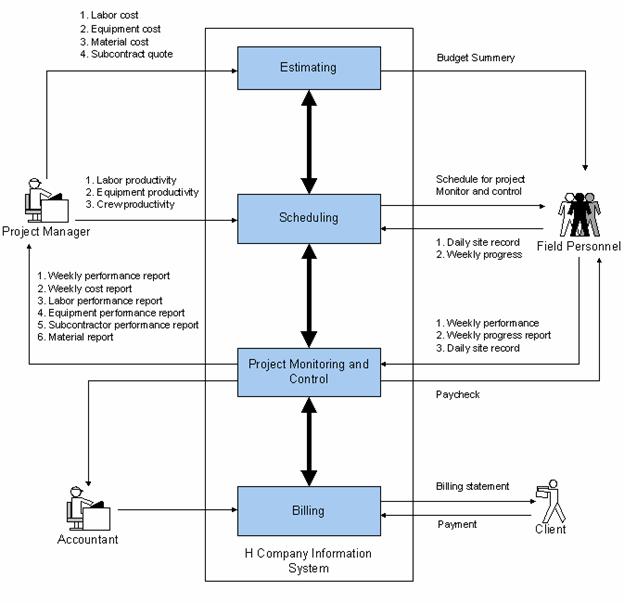
Figure 1 shows the operation flow chart for the HCC. The estimators do quantity taking off for the projects, and after it is checked by the project engineer they call suppliers for quotations. The bookkeeper maintains the as-built drawing using the daily report from superintendents for pay-app purposes as well as other paper work such as change orders if the as-built quantity is not same as the planned. The accounting department takes care of all the accounts payable and receivable with the help of the front desk receptionist.
|
|
Quantity Estimates for the Project
The company uses the unit-price contract type. The following are regular bid items:
|
Storm Drainage | |
|
Sanitary sewer | |
|
Water distribution (potable water) | |
|
Fire and irrigation (non-potable water) | |
|
Roadway sleeve | |
|
Utility trenching |
After review the engineering drawing, the estimator takes off the quantity of each type of bid item. For utility projects, one of the most important jobs is to estimate the quantities of soil to be moved and backfilled. For this strenuous job, the HCC has developed a spreadsheet for making this job easy, and compiles the information from the engineering drawings:
|
Total soil moved (CY) | |
|
Pipe length for different depth | |
|
Manhole numbers and depth distribution | |
|
Average Pipe depth | |
|
Number for both single and double services |
Besides the information from spreadsheet, the cost information needed for estimating are:
|
Hourly cost of ownership and operation of the machinery | |
|
Hourly cost of labor, operators | |
|
Fringe benefits | |
|
Subcontractor cost. |
By extracting the information from spreadsheet, the cost of the material, labor, equipment, etc can be generated. The total cost is the sum of the material cost, equipment cost, labor cost, and overhead and benefit. The bidding sheet will be prepared by estimators. The next step is to decide the project duration.
Several items must be known in order to estimate project duration:
The quantity of work for a project.
|
Available resources (how many crews and pieces of equipment are available). | |
|
The equipment production rate. | |
|
The crew production rate. |
The first item is known through estimating. The second item is to make sure what resources are available. The HCC has eight main line crews (water sewage crew) and five miscellaneous crews. Some crews may already have their work on hand done. Other crews almost have their work done. Management personnel will know which crew will be available at the required time. The following describes the equipment and crew production rates.
Estimate equipment production rate
The equipment production rate is determined by several factors such as optimum production rate, equipment capacity factor and soil swell (load) factor. For different brands of equipments, the company usually calculates the production rate from the operator’s manual which the manufacturers give to the company. The equipment optimum production rate is calculated as the following:
![]() (Equation
1)
(Equation
1)
However, the equipment production rate is affected by other factors such as soil swell factor, equipment capactiy factor, therefor equipment production rate is determined by the following equation:
Equipment Production Rate = Equipment Optimum Production Rate × Equipment Capacity Factor × Soil Swell (Load) Factor (Equation 2)
Estimate the Production Rate for Each Crew from the Time Sheet
The last item before scheduling a project is to calculate the crew production rate from the historical data. The company collects data from the superintendents’ dairy reports. The data collected from this daily report are:
|
The cubic yard of soil excavated | |
|
The length of pipe laid | |
|
The exact labor hours spent for laying pipes |
The company collects data for each type of pipe in order to estimate the productivity of crews. The productivity of the crews is affected by pipe depth, pipe size, the number of structures (manholes), structure depth, working condition (city or country), and skills of crews. These parameters affect productivity as follows:
|
Depth of pipe and structure (manholes): the deeper the pipe’s location, the more time it takes to excavate the trench, the more time spent on shoring; the lower the productivity of the crew. Table 1 shows the production rates for laying 8” PVC sanitary sewer line at different depth. (manholes). The explanation also applies to the structures. |
|
Production Rate for Laying 8” PVC Sewer Lines for HCC |
|
|
Sewer Pipe Depth |
Production Rate ( L.F./Day) |
|
0 – 6’ |
790.00 |
|
6 – 8’ |
715.00 |
|
8 – 10’ |
640.00 |
|
10 -12’ |
565.00 |
|
12 -14’ |
490.00 |
|
14 -16’ |
415.00 |
|
16 -18’ |
340.00 |
|
18 -20’ |
265.00 |
|
20 -22’ |
190.00 |
|
Pipe size: it affects production rate since smaller pipe sizes are easier to install and allow the crews to move faster. Table 2 illustrates the production rate for laying storm drainage pipe based on the pipe size and pipe depth. If a pipe is laid at the same depth range, the production rate will decrease with increases in pipe size. |
|
Production rates of laying storm drainage pipe |
|||||||
|
Depth of Pipe |
Productivity on Pipe Size (Feet/Day) |
||||||
|
12” -24” |
30” |
36” |
42” |
48” |
54” |
60” |
|
|
0’ – 6’ |
596 |
571 |
475 |
449 |
420 |
410 |
400 |
|
6’ – 8’ |
525 |
501 |
415 |
374 |
370 |
360 |
355 |
|
8’ – 10’ |
483 |
459 |
394 |
350 |
330 |
325 |
320 |
|
10’ – 12’ |
453 |
430 |
379 |
330 |
310 |
300 |
280 |
|
12’ – 14’ |
430 |
407 |
367 |
275 |
270 |
260 |
250 |
|
14’ – 16’ |
411 |
388 |
357 |
255 |
250 |
240 |
230 |
|
16’ – 18’ |
395 |
372 |
330 |
239 |
230 |
220 |
210 |
|
18’ – 20’ |
381 |
359 |
320 |
224 |
220 |
200 |
190 |
|
Above 20’ |
369 |
347 |
300 |
211 |
200 |
180 |
170 |
|
The number of structures: the more manholes that need to be constructed for a project, the more times the work continuity of crews is disrupted; the productivity of crew is slowed down by an increased number of manholes. | |
|
Working condition: in the city, the crews need to control traffic and pay more attention to existing utility lines, which prevents the crews from moving faster. Table 3 shows the average production for projects that HCC Construction Company undertook. The production rates here do not apparently indicate the differences between city area and rural area since there are other factors that affect production rates, such as pipe size, the number of structures in each project, skills of crews, etc. |
|
Production rate from historical project |
||||
|
Depth Range |
Projects in rural area |
Projects in city |
||
|
Harvest Meadows (F.T./Day) |
Hardwood Trails (F.T./Day) |
Unit88-Villages (F.T./Day) |
SW67th (F.T./Day) |
|
|
0'-6' |
356 |
605 |
842 |
|
|
6'-8' |
1106 |
711 |
529 |
|
|
8'-10' |
561 |
549 |
503 |
640 |
|
10'-12' |
|
|
386 |
|
|
12'-14' |
|
489 |
258 |
504 |
|
14'-16' |
|
330 |
|
193 |
|
16'-18' |
|
|
|
198 |
|
18'-20' |
|
|
|
313 |
|
20'-22' |
|
|
|
162 |
|
Skills of crews: obviously the productivity of crews would be higher if the crew members are skilled laborers. |
The duration of a project is determined by:
![]()
![]() (Equation 3)
(Equation 3)
Where:
![]() :
duration of a project;
:
duration of a project;
![]() :
duration of constructing utility line i of a project;
:
duration of constructing utility line i of a project;
i: a specific utility line;
t: the total number of utility lines of a project;
The duration of a utility line is estimated by:
![]() (Equation 4)
(Equation 4)
Where:
![]() :
duration of constructing utility line i of a project;
:
duration of constructing utility line i of a project;
![]() :
duration of installing manholes of a project;
:
duration of installing manholes of a project;
![]() :
duration of constructing main pipe of a utility line i for a project;
:
duration of constructing main pipe of a utility line i for a project;
![]() :
duration of constructing service pipe of a utility line i for a project;
:
duration of constructing service pipe of a utility line i for a project;
i: a specific utility line;
If the contract gives the duration and the contract duration is shorter than the duration estimated from the above equations, then the management personnel may add more crews to this project.
Information Requirements of Project Monitoring and Control
After the company is awarded a bid and a contract is signed as shown in Figure 1, the project monitoring and control phase will start. The construction management personnel requires the schedule can easily or directly tell:
|
The relationship between exact location and planned construction time | |
|
The construction productivity of each utility line | |
|
The work space conflicts among utility lines | |
|
The accurate construction progress of each utility line | |
|
The work flow of each crew |
The above introduces the HCC’s background, organizational structure, its project operation model, and information requirements of project monitoring and control. The following will introduce how a project is scheduled in HCC and the problems faced by HCC.
The Villages is a huge community development project located in Ocala, Florida. It includes many units, such as Unit 97, Unit 98, and Unit 99, etc. Each Unit is composed of several hundred housing lots. The Villages Unit 97 is a typical project that HCC usually works on. HCC undertakes the construction of the underground utilities of the Unit 97. The utility lines include: Storm Drainage, Sanitary Sewer, Fire/Irrigation Water, and Potable Water. The Roads and Lot Grading are subcontracted out.
The work on each utility line of the Unit 97 project is described as follows (Table 4 shows the summary of project information):
|
Summary of Project Information |
||||||||||
|
|
Crew |
Length of Line (feet) |
Avg. Depth (feet) |
Range of Pipe Diameter |
Man-hole |
Earth Moving |
Single Service Line |
Double Service Line |
Box Meter |
Gate Valve |
|
Storm Drainage |
1 |
7,113 |
10.7 |
12”- 54” |
61 |
29,753CY |
-- |
|
-- |
|
|
Sanitary Sewer |
2 |
7,663 |
10 |
8” PVC |
35 |
18,668CY |
12 (avg. 30’ long) |
97 (avg. 25’ long) |
-- |
|
|
Potable Water |
3 |
9,415 |
>=3 |
4”- 12” |
-- |
-- |
3560 feet long with 1” diameter |
|
23 single, 90 double |
16 |
|
Irrigation/Fire Water |
3 |
8,895 |
>=4 |
4”- 8” |
-- |
-- |
3,480 with 1” diameter |
|
9 single, 97 double |
17 |
Estimating Construction Duration for the Utility Lines
The first attempt to build a schedule consisted of dividing the project into four main lines since the project has four main components: (1) Sanitary Sewer Line; (2) Storm Drainage Line; (3) Potable Water Line; and (4) Irrigation/Fire Water Line. The following section will describe how to estimate the construction duration of the sewer line, the storm drainage line, the potable water line, and the irrigation/fire water line.
Estimate of Sewer Line Construction Duration
The duration of sewer line construction is affected by the rate of production. It consists of three components: the construction durations for the main sewer line, for the manhole construction, and for the service line.
Duration of Main Sewer Line-- The Unit 97 project only uses 8” diameter PVC as its sewer pipe. In order to determine the rate of productivity which is affected by the depth of the sewer pipe line, the whole main sewer line is categorized into different depth ranges:
0 – 6’
6 – 8’
…..
26’-28’
28’-30’
The depth and length of the main sewer line is itemized based on these categories in Table 5. In the fourth column, the total duration for laying the main sewer line is determined to be14.13 days.
|
Estimated Duration of Main Sewer Line |
|||
|
Depth |
Length of Pipe Line (feet) |
Productivity (feet/day) |
Pipe Duration (days) |
|
0’-6’ |
3,197 |
790 |
4.05 |
|
6’-8’ |
1,936 |
715 |
2.71 |
|
8’-10’ |
284 |
640 |
0.44 |
|
10’-12’ |
332 |
565 |
0.59 |
|
12’-14’ |
213 |
490 |
0.43 |
|
14’-16’ |
268 |
415 |
0.65 |
|
16’-18’ |
787 |
340 |
2.31 |
|
18’-20’ |
233 |
265 |
0.88 |
|
20’-22’ |
413 |
200 |
2.06 |
|
22’-24’ |
- |
170 |
- |
|
24’-26’ |
- |
150 |
- |
|
26’-28’ |
- |
120 |
- |
|
28’-30’ |
- |
100 |
- |
|
Total |
7,663 |
|
14.13 |
Manhole Construction Duration-- The duration of manhole construction is also affected by the depth of the installation. The deeper the installation, the slower the productivity is. Therefore the rate of production is categorized into various depth ranges as for the main sewer line. The quantities for the manholes are computed based on these depth ranges.By applying similar method described in estimating duration of main sewer line, the total duration for manhole construction is 4.375 days.
Estimate of Service Line Installation Duration—The duration for Table 6 shows the predicted duration for installing the service lines.
|
Predicted Duration of Installing Service Line |
||||
|
Service Line |
Units |
Avg. Length of Each Unit (feet) |
Productivity ( units/day) |
Duration (days) |
|
Single |
12 |
30 |
15 |
0.80 |
|
Double |
97 |
25 |
15 |
6.47 |
|
Total |
109 |
|
|
7.27 |
The total duration for laying the sewer line is computed by:
![]() =
14.13 + 4.375 + 7.27 = 25.77 days
=
14.13 + 4.375 + 7.27 = 25.77 days
Here i represents the sanitary sewer line.
Estimate of Storm Drainage Line Construction Duration
The estimate of the storm drainage line construction duration consists of two components: the duration for the construction of the main storm drainage line, and that for the manhole construction. By using the similar method as described in sewer line construction, The duration for laying storm drainage line is computed using the following equation:
![]() =
17.80 + 6.70 + 0 = 24.50 days
=
17.80 + 6.70 + 0 = 24.50 days
Here i represents the storm drainage line.
Estimation of Potable Water Line and Irrigation/Fire Water Line Construction Duration
The construction of the potable water line and the irrigation/fire water line is not as complicated as the sewer line and storm drainage line. The lines are covered by 4 feet thick dirt. The construction durations for the construction of the potable water line and the irrigation/fire water line are determined by the production rate of each of these two lines. Table 7 lists the predicted construction duration for these two lines.
|
Predicted Duration of Potable Water Line and Irrigation/Fire Water Line |
|||
|
Utility Lines |
Length of Line (feet) |
Productivity ( feet/day) |
Duration (days) |
|
Potable Water |
9,415 |
920.00 |
10.23 |
|
Irrigation/Fire Water |
8,895 |
930.00 |
9.56 |
Table 8 lists the information for each line based on its length, crew allocation, rate of production, estimated duration. Three crews are assigned to the Unit 97 project. The crew one works on the storm drainage line and crew two works on the sanitary sewer line. Both of crews start their work on the same date (day 0). Crew three works on two lines, the potable water and the irrigation/fire water lines. It works first on the potable water line and then on irrigation/fire water line.
|
Summary of Unit 97 Utility Lines |
||||||
|
Crew |
Duration (days) |
Length of Line (feet) |
Rate of Production (feet/day) |
Start Time |
Finish Time |
|
|
Storm Drainage |
1 |
24.40 |
7,113 |
291.52 |
0 |
25 |
|
Sanitary Sewer |
2 |
25.77 |
7,663 |
297.36 |
0 |
26 |
|
Potable Water |
3 |
10.23 |
9,415 |
920.00 |
0 |
11 |
|
Irrigation/Fire Water |
3 |
9.56 |
8,895 |
930.00 |
11 |
21 |
|
Project |
- |
- |
- |
- |
0 |
Max. = 26 |
Scheduling Unit 97 by Linked Bar Chart
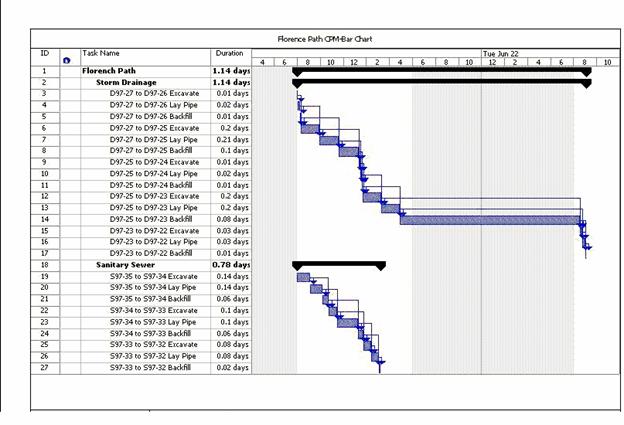
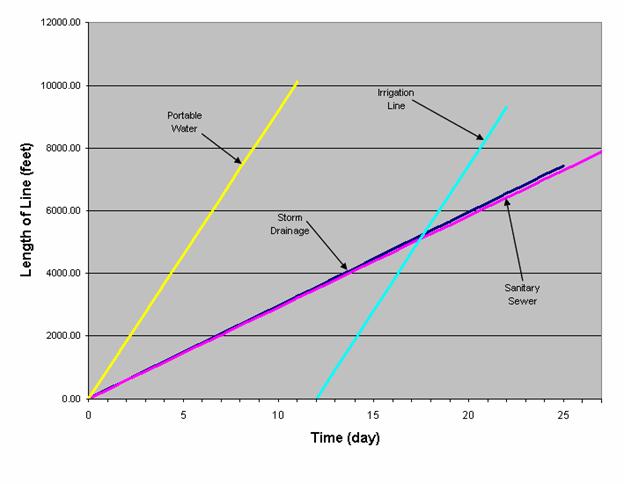
All of the above information is used to develop the Linked Bar Chart schedule and Linear Schedule Method for the Florence Path of Unit 97 project. The Linked Bar Chart is shown in Figure 2 and the linear schedule method diagram is shown in Figure 3.
|
|
The linked bar chart schedule shows repetitive activities (Excavate, Lay pipe, and Back fill) in the storm drainage line and sanitary sewer line. It illustrates how laborious the linked bar chart method is in planning the repetitive projects. Although it is time-scaled chart, the logical links of repetitive activities of each section do not make much sense in the presentation:
The locations of utility line sections are described in repetitive activities in Gantt Chart. It does not graphically tell the location of the utility line sections. The longer the utility line, the more repetitive activities in Gantt Chart.
Althought the repetitive activities show the location of utility line scetions, it does not tell the length of each utility line section. In other words, the user can not get direct work quantity from the Gantt Chart. The Gantt Chart can not reflect the production rate of utility lines. Although Gantt Chart can roughly identify the progress of the project, it can not acurately tell the user the information of the progress, such as the utility length that the crew has already finished.
Furthermore, in the case of two or more pipe lines intersecting somewhere on the site, where the elevation of one utility pipe is lower than the other, if the crews arrive at this kind of location simultaneously, obviously only one crew can continuously work and the other crews have to stop and wait until the first one to finish. The Gantt Chart can not indicate these interference locations and predict the possible interruption time.
Scheduling Unit 97 by Linear Scheduling Method
Since the Gantt Chart scheduling method can not give such information as HCC needs, HCC tries using Linear Scheduling Method to retrieve information for project Unit 97. By using the data that is listed in Table 8 such as the start time and finish time for each utility line, the estimated project duration is 26 days. Storm drainage and sanitary sewer lines are undertook by three separated crews and they started from day 0. The potable water and the irrigation/fire water lines are constructed by the same crew. The potable water line is installed first. After it is completed, the same crew will start installing the irrigation/fire water line. The horizontal axis represents the time in day unit. The vertical axis represents the location or line length in feet. Only four utility lines appear in the Figure 3:
|
The crew 3 constructs the potable water line. The construction of potable water line starts at day 0 and finishes at day 10.23. | |
|
The construction of irrigation/fire line starts right after the completion of potable water line. It starts at day 11 and finishes at day 21. The duration of irrigation/fire line construction takes 9.56 days. | |
|
The crew 1 constructs storm drainage line. It starts work at day 0 and finishes at day 24.4 | |
|
The crew 2 constructs sanitary sewer line. It starts work at day 0 and finishes at day 25.77. |
There are no repetitive activities in the Figure 3. User can identify through linear scheduling:
The relationship between locations of utility line sections and planned construction time. Linear scheduling method illustrates at what time how long the utility line would be completed. It establishes the time-location coordinates.
· The production rate for each utility lines.
· The work flow of the crews. For example, the crew 3 works on the potable water line and then on the irrigation/fire line.
· The acurate progress of the project through the time-location coordinates instead of the rough completion percentage indicated in Gantt Chart.
Although the Linear Schedule Method clearly presents the production rate of each utility line, the start time and finish time, and accurate progress for the individual schedule date, but it can not illustrate the interference locations, and predict the interference time in the case of two or more pipe lines intersecting somewhere on the site. The interference slows down the construction progress, interrupts the work continuity of the crews, and therefore lowers the production rate which may even stop the work of crews, delay the project, and incur cost overruns.
|
Comparison of schedule tools over the project – Florence Path |
||
|
Scheduling Method |
Linked Bar Chart |
Linear Scheduling Method |
|
Time-based chart |
√ |
√ |
|
Space-based chart |
- |
√ |
|
Time buffer |
- |
√ |
|
Space buffer |
- |
√ |
|
Identification of project progress |
Sort of without identifying the exact location |
√ |
|
Production rate |
- |
√ |
|
Flow of labor |
- |
Different production rates indicate the flow of labor, and the crew transition among the utility lines |
|
Space Conflicts |
- |
- |
Conclusion
This paper describes in detail the construction planning and scheduling procedures of the utility construction company HCC. It presents the processes and techniques of construction duration estimation for each utility line under various construction environments. In order to meet the specific scheduling requirements from the construction management personnel, which are:
|
The relationship between exact location and planned construction time | |
|
The construction productivity of each utility line | |
|
The work space conflicts among utility lines | |
|
The accurate construction progress of each utility line | |
|
The work flow of each crew |
The company tried two scheduling methods – linked time-scaled Gantt Chart and Linear Scheduling methods, and compared these two methods based on the information extraction requirements. The comparison is listed in the Table 9. Although linear scheduling method can satisfy the information requirements from construction management personnel from many respects compared to the Gantt Chart method, it still does not solve the work space conflicts among utility lines which are caused from the elevation differences of lines at the intersected location. A methodology is expected to be developed by further research. This method should be able to identify accurately the intersected location, estimate the construction interference time, and adjust the schedule to avoid the construction interruption. It would help keep the continuity of crew work, and avoid the delay of construction and cost overruns
References:
Ammar, M. A. & Mohieldin, Y. A. (2002), Resource constrained project scheduling using simulation. Construction Management and Economics, 20, 323-330
Arditi, D. & Albulak, M. Z. (1986), Line-of-Balance scheduling in pavement construction, Journal of Construction Engineering, 112(3), 411-424
Arditi, D., Sikangwan, P., & Tokdemir, O. B. (2002), Scheduling system for high rise building construction, Construction Management and Economics, 20, 353-364
Chrzanowski, E.N. & Johnston, D.W. (1986) Application of linear construction. Journal of Construction Engineering, ASCE, 112(4), 476-491
Harris, R.B. (1996) Scheduling projects with repeating activities. UMCEE Report No. 92-96, Civil and Environmental Engineering Department, University of Michigan, Ann Arbor, MI.
Harris, R.B. & Ioannou, P.G. (1998) Scheduling projects with repeating activities. Journal of Management in Engineering, ASCE, 124(4), 269-276.
Lumsden, P. (1968). The line of Balance Method, Pergarnon Press, London
Lutz, J.D. & Hijazi, A.(1993), Planning repetitive construction: current practice, Construction Management and Economics, 11, 99-110
Mattila, K.G. & Abraham, D.M. (1998) Resource leveling of linear schedules using integer linear Programming. Journal of Construction Engineering and Management, ASCE, 124(3), 232-244
Mubarak, S. (2003). Construction project scheduling and control, Prentice Hall, Upper Saddle River, New Jersey. 13-14
Rahbar, F.F. & Rowings, J.E. (1992). “Repetitive activity scheduling process.” Trans. Am. Assn. of Cost Engrs., 2, 0.5.1-0.5.8
.
Reda, R.M. (1990) RPM: Repetitive project modeling. Journal of Construction Engineering and Management, ASCE, 116(2), 316-330
Russell, A. D. & Wong, W.C.M. (1993). New generation of planning structures, Journal of Construction Engineering and Management ASCE, 119(2), 196-214
Selinger, S. (1980) Construction planning for linear projects. Journal of the Construction Division, ASCE, 106(CO2), 195-205
Stradal, O. & Cacha, J. (1982) Time space scheduling method. Journal of the Construction Division, ASCE, 108(CO3), 445-457
Suhail, S.A. & Neale, R.H. (1994) CPM/LOB: new methodology to integrate CPM and line of balance. Journal of Construction Engineering and Management, ASCE, 120(3), 667-684