- ASC Proceedings of the 42nd Annual Conference
- Colorado State University Fort Collins, Colorado
- April 20 - 22, 2006
|
|
|
Planning and Controlling Lean Construction Projects
|
Hazem Elzarka, PhD, PE, LEED AP University of Cincinnati Cincinnati, Ohio, USA |
|
Eliminating waste is an important objective of lean construction. On construction projects, significant waste may occur because of interrupted workflow of resources and unnecessary labor idleness. Such idleness occurs primarily due to unbalanced production rates of construction activities. Balancing activities’ production rates is an important step for minimizing waste and successfully implementing lean construction principles. The tool used for planning and controlling lean construction projects should easily identify any imbalance in production rates and provide a simple method to correct this imbalance. The paper argues that despite the wide acceptance of the CPM method, it cannot be effectively used for lean construction projects. The paper then discusses the Line of Balance method and its potential use for planning and controlling lean construction projects.
Key Words: Lean Construction, Linear Scheduling, Line of Balance, project planning, project control, CPM method.
|
Introduction
The objective of lean construction is meeting customer needs while eliminating waste. Lean production was developed by Toyota Manufacturing Company. The goal of the Toyota lean production system is to produce a car to the requirements of a specific customer, deliver instantly while eliminating waste and maintaining no inventories (Howell 1999). The Toyota Lean production system differs from the mass production system initially developed by Ford. The primary goal of the mass production system is to minimize vehicle cost by keeping each machine in the assembly line running at maximum production. The mass production system focuses on a one-dimensional objective, which is the optimization of cost. This one-dimensional focus caused defects to be left in cars as they passed down the line to keep the assembly line moving. The Toyota lean production system on the other hand aims to achieve a multi-dimensioned standard of perfection that considers criteria other than cost (such as customer requirements, waste minimization, quality, etc). The lean production system prevents sub-optimization and promotes continuous improvement (Howell 1999).
Central to lean construction is to ensure that the workflow of resources is uninterrupted (Ballard and Tommelein 1999). Work continuity of resources minimizes waste and reduces resources’ idleness. Unfortunately, on many construction sites, it is common to see interrupted workflow of resources and unnecessary labor idleness (Harris and Ioannou 1998). Such idleness occurs primarily due to unbalanced production rates of the various activities. Idle labor and equipment resources are usually waiting because the preceding labor resources have not finished their jobs. In addition to the waste resulting from labor idleness, crew productivity also suffer because some crews intentionally slow down when they expect that they will be waiting for the preceding crews.
Imbalance in activities production rate also leads to labor hiring problems where idle labor resources have to be fired and re-hired. Firing and rehiring of workers is a significant de-motivator for crews (Business Roundtable 1982). In addition, rehiring of workers may not always be easy especially when there is shortage of skilled labor. In such a case, workers who leave for another job may not be willing to come back on time (Ashley 1980). Hiring new crews to complete the job requires re-training, and eliminates any potential productivity gains from the learning curve.
From the discussion above, it is clear that balancing the production rates of the various activities is an important step for successfully implementing lean construction. For this reason, the tool used for planning and controlling lean construction projects should easily identify any imbalance in production rates and provide a simple method to correct this imbalance in order to ensure the smooth procession of crews throughout the project.
Despite the wide acceptance of the CPM method as a planning and controlling tool for construction projects, it cannot be effectively used for lean construction projects. The next section discusses the deficiencies of the CPM method for planning and controlling lean construction projects. The paper then discusses the Line of Balance method and discusses its potential use for planning and controlling lean construction projects.
Short Comings of CPM for Planning and Controlling Lean Construction Projects
CPM-based techniques are not adequate for eliminating waste as required by lean construction principles. The fact of having “non-critical” activities implies that the CPM based plan incorporates potential waste (Melles and Welling 1996, Mendes and Heineck 1998). The planning and controlling of lean construction projects require a tool that not only optimize project duration but also balance activities’ production rate to eliminate work stoppages, resource idleness and associated productivity loss. The CPM algorithm does not deal adequately with the uninterrupted workflow requirements of lean construction projects. Because there is no indication of production rates in CPM networks, workflow interruption could not be anticipated by the scheduler during the development of the network and as such can’t be adequately managed. Therefore, the CPM algorithm has no capability that would ensure a smooth procession of crews from unit to unit with no conflict and no idle time for workers and equipment. This leads to hiring and procurement problems in the flow of labor and material during construction (Arditi 1988).
Line of Balance Method
The line of balance method is a planning and control method whose goal is to determine a balanced mix of resources and synchronize their work so that they are fully employed and uninterrupted (Hegazy 2002). The LOB method allows for both the smooth procession of resources within an individual activity and for balancing the production rates of interrelated activities such that each activity is continuously performed.
Another benefit of the LOB technique is its graphical representation of the schedule which provides both production rate and duration information in an easily interpreted graphical format. The LOB graphical representation requires less time to produce than CPM schedules and contains additional production rate information not found in CPM schedules. The LOB graph can show at a glance what is wrong with the progress of a project and can detect bottlenecks. Once detected, these bottlenecks can be avoided by adjusting the activities’ rate of production on the LOB graph.
The LOB was originally derived from the manufacturing industry (Neale and Neale, 1989) and was developed by the U.S. Navy Department in 1942 for the programming and controlling of repetitive projects. It was later developed by the National Building Agency (in the United Kingdom) for repetitive housing projects (Suhail and Neale, 1994).
Line of Balance Representation of a Single Activity
Figure 1 illustrates the representation of a single activity using the LOB method. A sloping bar represents each activity. The width of the bar is the activity duration for one unit. The left and right boundaries of the bar denote the start and finish times respectively of the activity in all the units. The slope of each bar represents the activity’s planned rate of progress. The production rate of the activity can be increased by increasing the number of crews. The activity bar in Figure 1 shows that there are 2 crews working on this activity. Each crew knows in advance what unit it will be working on. In figure 1, each crew moves to a new unit as soon as it finishes with the previous one without interruption. Thus, there is a smooth procession of resources within the individual activity and the natural rhythm of the activity is achieved. The natural rhythm of an activity is defined as the optimum rate of production that a crew of optimum size will be able to achieve (Arditi 1988). If an activity’s rate of production differs from a multiple of its natural rhythm, then idle time for labor and equipment will be inevitable.
Balancing Production Rates of Dependent Activities
In addition to allowing for a smooth procession of resources within an individual activity, the LOB method can be used to manage the interaction between activities. If the initial production rates of the dependent activities are not similar, the LOB graph can be easily used to adjust production rates in order to reduce work stoppages. If a certain work stoppage is necessary, the time of the stoppage can be easily determined from the LOB graph. In the following section, a sample project will be used to illustrate how the LOB is used to balance the production rates of dependent activities.
Figure 1: LOB representation of a single activity
Sample Project
Figure 2 shows a sample multi story project that will be used to illustrate the use of the LOB method. For the sake of simplicity, the project is assumed to be 5 stories only. Each floor is divided into 8 sequences labeled A, B, C, D, E, F, G, and H. Each sequence is considered as one unit. The total project thus has 40 units. For each unit the activities shown in Table 1 need to be performed.
If we assume that only one crew will be used for each activity, we can calculate the production rate (R) for each activity knowing the activity’s duration D as:
R = 1/D
The production rates of all activities are shown in Table 2:
Studying table 2, we can see that the production rate of all activities are not similar. If these production rates are used, the project will not be synchronized (balanced). An objective of the LOB methodology is to have the production rates of all repetitive activities to be similar. This can be achieved by increasing the number of crews for those activities with long duration. The production rate R in this case can be calculated knowing the number of crews (C) and the duration of each activity as:
R = C/D
Using this equation, we can determine the number of crews that would result in “similar” production rates for all activities. Note that it is not always possible to have exactly the same production rates for all activities, but we should try to have similar rates. Table 3 shows a new scenario in which some activities have more than one crew. This scenario produces better production rates for the activities (i.e., production rates that are similar).

Figure 2: Sample Project.
Table 1. Activities descriptions and duration of a typical unit
|
Activity |
Description |
Duration (Days) |
|
1 |
Erect forms |
6 days |
|
2 |
Reinforce |
3 days |
|
3 |
Pour Concrete |
3 days |
|
4 |
Cure Concrete |
7 days |
|
5 |
Strip forms |
2 days |
|
6 |
Construct Brick Wall |
12 days |
|
7 |
Install windows |
8 days |
Drawing the LOB Chart
Table 3 can be used to draw the LOB chart where the x-axis represents time and the y-axis the number of units to be produced. As shown in Figure 3, each sloping bar represents one activity (1,2,3,4, etc.) in the project and the width of the bar is the activity duration for one unit (one sequence of each floor). The left and right boundaries of the bar denote the start and finish times respectively of each activity in all the units. The slope of each bar represents the activity’s planned rate of progress as indicated in Table 3. Once the first activity is plotted on the LOB graph, the production rate of the succeeding activity should be compared with that of the first activity. If the production rate is the same, the succeeding activity’s bar will be parallel to the first activity. This is the case for activities 1, 2, 3 and 4. Activity 5 however has a larger production rate than 4, and therefore can not start until sufficient lead time is provided, to prevent a conflict in the precedence relationship between the two activities. In this case, activity 5 is scheduled starting at the top unit and the start of activity 5 in unit 1 is delayed to allow activity 5 to proceed at its desired high rate without interruption. When activity 6 is plotted, a different situation is encountered; a slower activity (6) is to follow a faster activity (5). In this case activity 6 can be scheduled starting from unit 1 immediately following activity 5 of unit 1.
The number of crews employed in each activity can be graphically represented with each crew indicated by a different pattern. Crew representation is shown for activities 1 and 6. Activity 1 has 2 crews and activity 6 has 3 crews. Similar representations can be done for all other crews. Looking at the crew representations for activities 1 and 6, we can see that each crew moves to a new unit as soon as it finishes with the previous one without interruption. Thus, work continuity is maintained and the natural rhythm of the activity is achieved. It can also be concluded from Figure 3 that the project is completed on day 236 which is the finish date of the last activity of the last unit (i.e. finish date of activity 7 in the 40th sequence).
Table 2. Activities production rates if only one crew is used
|
Activity |
Description |
Duration (Days) |
Production Rate |
|
1 |
Erect forms |
6 days |
1/6 |
|
2 |
Reinforce |
3 days |
1/3 |
|
3 |
Pour Concrete |
3 days |
1/3 |
|
4 |
Cure Concrete |
7 days |
|
|
5 |
Strip forms |
2 days |
1/2 |
|
6 |
Construct Brick Wall |
12 days |
1/12 |
|
7 |
Install windows |
8 days |
1/8 |
Table 3. Modified activities production rates when more then one crew is used
|
Activity |
Description |
Duration (Days) |
Number of Crews |
Production Rate |
|
1 |
Erect forms |
6 days |
2 |
1/3 |
|
2 |
Reinforce |
3 days |
1 |
1/3 |
|
3 |
Pour Concrete |
3 days |
1 |
1/3 |
|
4 |
Cure Concrete |
7 days |
|
|
|
5 |
Strip forms |
2 days |
1 |
1/2 |
|
6 |
Construct Brick Wall |
12 days |
3 |
1/4 |
|
7 |
Install windows |
8 days |
2 |
1/4 |
Analyzing the LOB Chart
The LOB chart can be easily analyzed to potentially improve the project schedule. A careful examination of Figure 3 shows that Activity 5 of the first unit (i.e. the first sequence of the first floor) was intentionally delayed. This was performed as stated in the previous section to allow activity 5 to proceed at its desired high rate without interruption. This however may not be the optimum solution for the given project. Another schedule may be easily developed from the initial schedule by allowing activity 5 to be interrupted after unit 20 as shown in Figure 4. Although this has the negative effect of a needed disruption in the workforce, it has a positive effect of reducing the total project duration to 216 days. Other changes could be made such as increasing the production rate of activities 6 and 7 to shorten the project’s total duration.
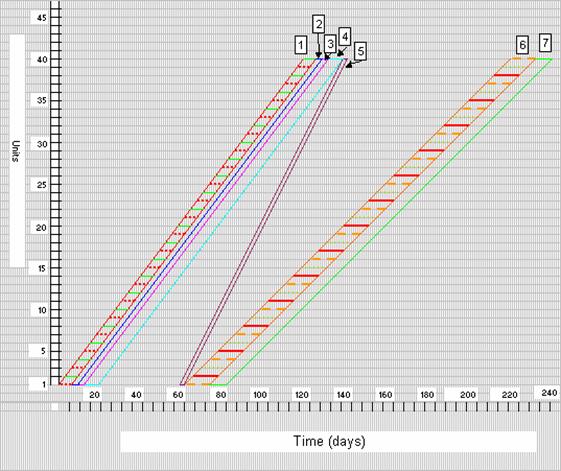
Figure 3: LOB chart for sample project
Discussion and Conclusions
The LOB method has the potential to be an effective tool for planning and controlling lean construction projects. The LOB method supports several lean construction principles. The LOB can be used to easily identify any imbalance in production rates and to correct this imbalance in order to ensure the smooth procession of crews throughout the project thus minimizing waste and reducing the need for interrupting the workflow of resources. In addition, the simple LOB graphical representation of the schedule makes the schedule information more visible to everyone involved with construction. Improved understanding of the schedule allows everyone involved to make better decisions in support of project objectives.
It is important to note that the LOB method as presented in this paper is not new. However it has not been widely utilized in the industry mainly because many construction professionals are not familiar with it and because there are not many computer programs that support it. Construction educators can help solve this problem by teaching the LOB method in their curriculum and by presenting papers on its use in construction conferences, conventions and trade meetings. In addition, construction researchers should develop computer software that automates the development of LOB charts.
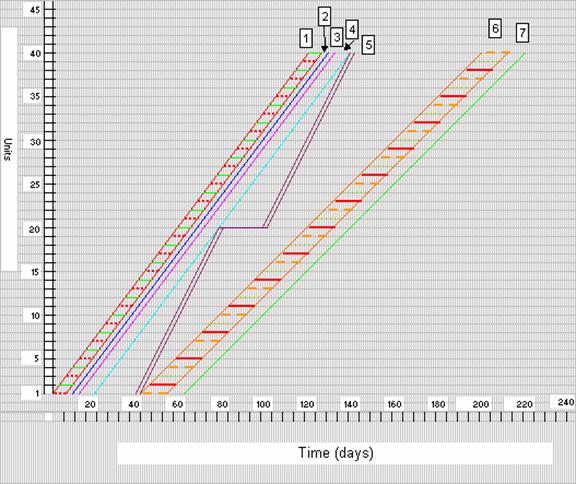
Figure 4: Modified LOB chart for sample project
References
Arditi, D. (1988) Linear Scheduling Methods in Construction Practice. In Proceedings of the Seventh Annual CMAA Conference, Rancho Mirage, CA.
Ashley, D.B. (1980). "Simulation of Repetitive-unit Construction." J. Constr. Engrg.,
ASCE, 106(2), 185-194.
Ballard, G. and Tommelein, I.D. (1999). "Aiming for Continuous Flow." LCI White Paper-
3, Lean Construction Institute, March 5.
Business Roundtable. (1982). "Construction Labor Motivation." Report A-2. New York.
Elzarka H. and A. Jiang. "Scheduling of Tall Buildings Projects Using Line of Balance Method". Proceedings of the Seventh International Conference on Multi-purpose High-rise Towers and Tall Buildings. Dubai, UAE, December 10-11, 2005.
Harris, R.B. and Ioannou, P.G. (1998). "Scheduling Projects with Repeating Activities." J.
Constr. Engrg. and Mgmt., ASCE, 124(4), 269-278.
Hegazy (2002). Computer-based Construction Project Management. Prentice Hall, New Jersey.
Howell, G. (1999) “What Is Lean Construction”. Proceedings Seventh Annual Conference of the International Group for Lean Construction, IGLC-7, Berkeley, CA, July 26-28, pp. 1-10.
Mendes, R., and Heineck, L. F (1998). “Preplanning Method for Multi-Story Building Construction using Line of Balance” Proceedings Sixth Annual Conference of the International Group for Lean Construction, IGLC-6, Guaruja, Brazil, August 13-15
Melles, B. and Welling, D.T. (1996). “Towards a different view on production control in construction.” Proc. 4th Conference on Lean Construction, http://www.vtt.fi/rte/lean/
Neale, R. H., and Neale, D. E. (1989). Construction Planning. 1st Ed., Thomas Telford Ltd., London, England.
Suhail, S. A. and Neale, R. H. (1994). CPM/LOB: New Methodology to Integrate CPM and Line Of Balance, Journal of Construction Engineering and Management, Vol. 120, No. 3, pp. 667-682
Yang I-T., and Ioannou P.G (2001). ”Resource-Driven Scheduling for Repetitive Projects: APull-System Approach”. Proceedings of the Ninth Annual Conference of the International Group for Lean Construction (IGLC-9). Singapore