- ASC Proceedings of the 42nd Annual Conference
- Colorado State University Fort Collins, Colorado
- April 20 - 22, 2006
|
|
|
Are Building Information Models Effective For Teaching Productivity Analysis?
|
Dennis M. Gier, MS, PE, Erin Loftin, and Kelly Coogan California State University, Chico Chico, California |
|
In this article the authors explore how effective Building Information Models (BIM) are as a teaching tool for teaching productivity analysis. The authors investigate the components, the advantages, and the disadvantages of BIM through observing student use. This article focuses on the students’ experience and feedback using BIM in the classroom. The authors believe that a BIM can be effective for analyzing productivity because a 3D model is linked to an actual project schedule, which enables a student to assign crews to different parts of the building at particular times during its simulated construction. If students can see an animation of a construction sequence, determine the quantity of work to be done, and assign crews, they could determine the productivity at virtually any point or analyze the productivity needed to meet the schedule. The authors investigated the above hypothesis through a qualitative evaluation survey of the student teams who worked with BIM to analyze productivity during the pre-construction phase of a new Student Service Building project on a California State University Campus.
Key Words: Building Information Modeling, Building Information Models, Building Intelligent Modeling, Productivity Analysis, Pre-Construction Planning, Project Management, Construction Methods Analysis, and Construction Education |
Introduction
Building Information Models (BIM) are a relatively new technology that began approximately six years ago. BIM is a ‘4D’ model that results from linking 3D graphic images from AutoCAD to the fourth dimension of time (Clayton, Parker, & Warden, 2001). Linking these two components simulates aspects of a project that are linked during the actual construction process. The model also allows a user to attach specific information to details of the project. If a particular material needs to be used in a part of the building, this type of note can be attached to that detail in the model (Koo & Fischer, 2000). The model also allows more than one user to make changes and updates even if the users are in different locations. The model is essentially what is called a ‘smart model’. The authors believed that by linking the components of a 3D model to a pre-determined schedule, students would be able to learn to analyze productivity.
To prove this hypothesis, the authors analyzed qualitative data from various perspectives, including student, faculty, and industry perspectives. The student perspective was taken from the students that worked with BIM at different phases of the project. The faculty perspective was obtained from interviewing the faculty who advised the students during this study. The industry perspective came from phone interviews with those companies who are currently using and developing BIM technology.
In addition to these perspectives, the authors completed a literature search of books, periodicals, and web sites that discuss virtual construction for pre-project planning, virtual construction for architecture, a study of 4D CAD, and construction project planning. The literature supported the idea that BIM has the potential to decrease project duration through analyzing a building model linked to a schedule prior to the actual beginning of construction. If there are building interferences, they could be detected earlier, saving time and money. Crews could be assigned to specific work phases in the project. This information could be used to determine productivity, which can then be analyzed and recommendations made for improvement.
The Power of BIM and Its Uses
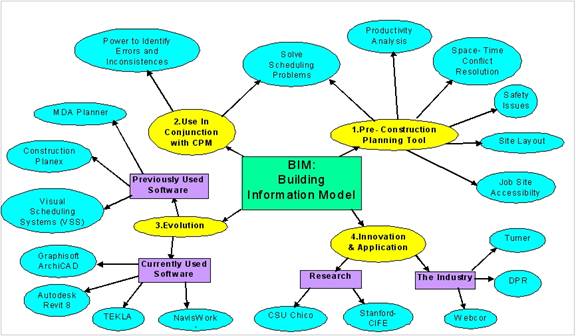
From the literature search the authors created a diagram (Figure 1) that outlines the current information about Building Information Modeling. They have divided the information into four main categories: 1. Pre-Construction Tool, 2. Scheduling Tool, 3. Evolution, and 4. Innovation & Application. Within these main categories they have divided the information further into more specific categories. It highlights the relationship between the research and current exploration of BIM. This diagram describes the purpose of BIM, the use of it in the industry, and the software that is the foundation of BIM. The literature search revealed that little has been written about using BIM to analyze productivity. This gap became the focus of this study.
|
|
|
Figure 1: The BIM Universe |
The construction industry is stepping into a new era, in which questioning the design, site-related activities, scheduling, and other pre-planning activities may be done more effectively. It is a time, in which alternatives to these questions may be compared side by side to achieve the best possible solution. This is done through a new technology, coined ‘Building Information Modeling (BIM),’ wherein all the information about a project is entered into a single, dynamic database. Herein, lays the true power of BIM. The information can then be extracted through any number of forms: plans, schedules, construction programs, or cost (Hunt, 2005).
With the inception of Autodesk’s AutoCAD in 1982 (Product News Network, 2005) the construction industry made significant progress towards being able to manipulate 2D plans with an ease and swiftness that was unparalleled at the time. Now, twenty-four years later we are stepping into the realm of intelligent modeling technology. The construction, architecture, and engineering industries have come to this new period of innovation and exploration by necessity. With growing competitiveness in the construction industry and increasing complexity in building design and systems, the amount of information and means of managing it needs to become more efficient. Currently “project participants involved in the project planning process are expected to visualize in abstract terms the perceived characteristics and spatial relationships among various components of the project, including site-related activities. Due to the interdependence between the different elements and the large amount of information that needs to be manually processed, this approach is difficult to undertake and imposes a heavy burden on the project team to carry out the planning process” (Thabet & Waly, 2002). The necessity for a collaborative, interactive model has become increasingly apparent due to such previous planning limitations.
The capability to produce a 3D model is not something that is entirely new to the industry, but the ability to manipulate it and extrapolate information in an interactive user-friendly environment is new. By combining the visualization aspects of a 3D model with the pre-determined schedule and project details and specifications, it is possible to analyze the project’s estimate and productivity. Previously used software, such as MDA Planner, Construction Planex, and Visual Scheduling Systems (VSS) used predetermined knowledge based programming to assist in planning a construction project. The user was mainly involved in the input of the data and not in the actual planning of the project. This not only disconnected the user from the model, but the user also had the least amount of responsibility for the outcome of the data (Thabet & Waly 2002). Furthermore, the user was burdened with large amounts of information that was irrelevant to their role and spent considerable amounts of time sifting through it (Kelsey & Winch 2005). Currently, through the use of integrated software the user has the ability to input specifications and details related to specific components of the project and control the model from start to finish. This enables the user to maintain complete responsibility for the model. Furthermore by manipulating and analyzing the model they are able to use it as an invaluable tool in the planning and management of the construction project. Examples of this intelligent 3D modeling software include Graphisoft ArchiCAD, Autodesk Revit, TEKLA, and NavisWorks (Bordenaro, 2005).
The horizon of intelligent modeling capabilities is constantly expanding. Through the research and development of Building Information Modeling technology at Stanford University’s Center for Integrated Facility Engineering (CIFE) and the Construction Management Department at CSU, Chico, new possibilities for using BIM are being discovered. The construction industry is crossing a new threshold and breaking new ground with the use of Building Information Models. Also, some interesting construction education studies, on using BIM in the classroom as a teaching tool, are being conducted at the Construction Management Department at CSU, Chico.
Using BIM in the Classroom
CM Faculty at CSU, Chico, who were interested in using BIM in the classroom, recently focused on the study question. “Are Building Information Models an effective tool for teaching productivity analysis?”
The lead author organized his construction methods analysis lab sections to allow twelve students within three, twenty-five person labs to experiment with using BIM to analyze productivity. Three, four-person teams in this construction methods analysis course in the spring of 2005 were assigned to use BIM to analyze productivity for an actual Student Services Building project on a California State University campus. These three groups of students were referred to as BIM TEAM #1, BIM TEAM #2, and BIM TEAM #3. They were assigned the Site Plan, Superstructure, and Substructure, respectively. There was one BIM TEAM per lab section. The goal of the teams was to use BIM for analyzing and improving productivity. Students were assigned to teams without regard to prior experience. They were upper division students learning about methods analysis, productivity, and BIM with only entry-level knowledge in all topics. Over the course of the semester, they learned how a BIM works, its components, and its advantages and disadvantages. While learning to use cutting edge software, they were also pioneering its usage for productivity analysis.
BIM TEAM #1 analyzed the site layout using the model. While studying the BIM, they noticed it did not layout the site per se; it was only modeling the building of the structure on the site. They decided the best way to analyze the productivity of a site layout was to break the construction into three phases, i.e. substructure, superstructure, and finishes. By breaking the construction down into these three major components, they could analyze the way the BIM was building the project, and design an appropriate site layout for each phase. Once they designed their site layouts, they could determine how productive the crews could be and plan for the most efficient site layout for each phase of the project.
BIM TEAM #2 analyzed the superstructure using the Building Information Model. This team struggled to analyze productivity because there wasn’t a crew assigned to the model. The BIM builds the steel structure according to the predetermined project schedule assigned to it by the model builders. However, TEAM #2 eventually was able to determine the quantity of work and material costs. One member said that they could then generate productivity for the steel erection phase because they knew exactly how much material was needed to do the work and the planned time to erect the steel from the project schedule. After they obtained the quantities of materials from the model, they were able to assign crews to the BIM, so that they could analyze a ‘hypothetical’ productivity for steel erection compared to standard production rates.
BIM TEAM #3 analyzed the substructure using the model. This team noticed that the model seemed to focus on the superstructure more than the substructure. They also found it difficult to analyze productivity because there wasn’t a crew assigned to the model. TEAM #3 learned, as TEAM #2 had, that they were able to determine the amount of work to be done because they knew exactly how many piles the structure had from studying the model. They were able to determine the length of the pile, as well. Eventually, they learned that if they used the quantity of piles from the model and the time information from the project schedule, that they could then calculate the ‘hypothetical’ productivity for constructing the substructure and compare it to standard production rates.
The first impression of all three teams was that the BIM was not an effective tool for analyzing productivity for two main reasons: first, a crew was not assigned to the work by the model, and second even if the user does assign a crew based on the amount of work, they can not observe the crew actually working, so they can not analyze actual productivity. But, the students did acknowledge that there was the possibility to analyze ‘hypothetical’ productivity. The BIM teams learned that by assigning their own crew based on the amount of material, work, and time allotted for the activity from the model that they could create the most efficient crew for the work activity.
The Method
The qualitative evaluation survey was designed to obtain information from the three student teams regarding their experiences using BIM to learn how to analyze productivity. By conducting this survey the authors hoped to determine what the students felt was the most beneficial aspect, what the advantages and disadvantages were, and what information the students could and could not obtain from the model. At the end of the Spring 2005 semester, 12 students were given the survey, one student did not reply to most of the questions, and another student felt they did not know enough about BIM to participate in the survey. Ten student evaluation surveys were used to compile the following data.
Student Evaluation Results
When asked how the students rated the overall effectiveness of a BIM to analyze productivity, the students had the option to rate 1(Low) through 10 (High). The average overall effectiveness rating was 5. The authors noted that the overall effectiveness ratings fell into two distinct groups. Four students rated it towards the high end of the effectiveness spectrum, while five students rated it toward the low end. Three students out of the twelve students did not rate the overall effectiveness of analyzing productivity using BIM.
The survey was broken into two parts, rated responses and open comments. The evaluation survey questions were designed to elicit feedback from the students about their experiences with BIM. The open comment section of the survey was an opportunity for the students to record their personal thoughts and experiences using Building Information Modeling.
For the rated responses, students were asked to respond to statements about the BIM, based on their experience. They rated the statements based on a Likert Scale, i.e. strongly agree, agree, neither agree nor disagree, disagree, or strongly disagree. A summary of their responses are recorded in Table 1 below:
From the students’ responses in the open comments section of the survey, it appears the students felt the two greatest advantages of using a BIM is its ability to find mistakes sooner than one could do manually and its ability to provide information that can not be obtained manually, or may be harder to obtain manually. The students felt the greatest disadvantage of using a BIM, is that it is not convenient for analyzing productivity. The students stated they felt this inconvenience was because there was not a crew to observe, which, they say, made it nearly impossible to analyze productivity. However, the authors believe the students overlooked the fact that productivity is calculated by dividing the quantity of work completed by the amount of time it took to complete it. Since the BIM is a 3D model linked to a schedule, it is possible to select a portion of the building, determine the amount of work being done, determine the duration of construction, and calculate the productivity.
Table 1: Summary of Students’ Rated Responses
|
Evaluation Criteria |
Strongly Agree |
Agree |
Neither Agree or Disagree |
Disagree |
Strongly Disagree |
|
1.BIM Provided Adequate Information |
0% |
20% |
10% |
40% |
30% |
|
2. BIM Can Analyze Productivity |
0% |
30% |
20% |
40% |
10% |
|
3. BIM Provided Additional Information |
0% |
50% |
30% |
10% |
10% |
|
4. BIM Saved Time |
0% |
40% |
10% |
30% |
20% |
|
5. BIM is More Convenient |
0% |
0% |
20% |
50% |
30% |
|
6. BIM finds mistakes sooner |
20% |
60% |
0% |
20% |
0% |
|
7. BIM effective even based on incomplete drawings |
0% |
20% |
40% |
40% |
0% |
The students also stated that another thing they learned from this assignment was how to design the most efficient crew for a project work activity. Because the model did not provide the students with crew information to analyze, they discovered that they needed to make their own crews if they wanted to be able to analyze productivity with a BIM. They were given a building project, assigned a predetermined project schedule and learned how to use the BIM to calculate the materials to be used and work to be done. They used their knowledge from the methods analysis class about effective crew sizes, and designed appropriate crews for particular phases of the project. After designing a crew, they could determine duration for a portion of the project they were trying to analyze.
The students’ reported perception of the inconvenience of using BIM to analyze productivity could be improved in future use by clearly stating in the assignment that students are required to assign ‘hypothetical’ crews to the parts of the building that they want to analyze. A student would know from the beginning to assign an appropriate crew after obtaining the amount of work being done from the model. A student could assign the crew based on standard production rates, and then determine the potential overall crew productivity.
Discussion
Are building information models an effective tool for teaching productivity analysis?
The Student Observer Perspective
Two honors students in the Construction Methods Analysis class were assigned to make observations about each team’s use of the model through out the semester. From the literature search, Building Information Modeling seemed like it would be the most valuable, if not the only current technology that could help students analyze productivity during the pre-construction phase. If a person had a 3D model linked to the project schedule, it seemed reasonable that one would also have access to productivity information. BIM team members did not anticipate crews not being assigned or attached to the schedule for the model. If a student can visualize the building being built, it seemed reasonable to think a student could visualize the crews needed to do the work, but students struggled with this aspect throughout the assignment.
The model did seem to be able to highlight many other valuable pre-construction planning aspects of the project. The BIM provided the user with the quantities of the selected material, so that a cost can be assigned, and total material cost determined. The BIM allowed the user to edit the assigned schedule as they saw fit to create a more efficient schedule once they discovered a work activity that had unproductive time, which shortened the overall project duration.
The student observers concluded that the BIM is the most efficient visualization tool that one could use to analyze a construction project. It allows students not only to see the construction project in 3D, but also to use it essentially as a ‘smart model’ for pre-construction planning. The BIM allows the user to visualize the building being constructed, according to a schedule, and with the ability to attach details and/or specifications. It also allows more than one user to change and edit the project model from different locations. The BIM can be a catalyst to improving productivity on a construction project.
The Faculty Perspective
From the standpoint of teaching methods analysis and productivity analysis, the faculty stated that they felt the most useful information the BIM provided to students was the animation of construction sequencing. The faculty also felt the students benefited the most from the visualization, crew evaluation, and the productivity analysis the BIM facilitated.
The faculty indicated the students using the BIM for productivity analysis, were at a disadvantage because they didn’t have a complete enough model to analyze. The model was based on only fifty percent complete construction drawings. Also, another class was actually building the model, while the methods analysis class was analyzing it. The faculty felt that if the methods analysis students themselves were involved with the building of the BIM, they would have known how to use it better to analyze productivity. The faculty observed that the BIM was challenging for the students to use because of its long learning curve. BIM is not an easy tool to use, especially if there is a lack of one-on-one guidance. To maximize the benefit of learning from a BIM, students need to be working in a structured lab setting with trained BIM assistants.
In this classroom experiment and from the point of view of conducting BIM Research, it appears the students learned more about how to design and manage effective crews by using a Building Information Model, than analyzing the actual productivity of a crew on a construction project. It appeared that the students learned by the end of the semester that both crews and productivity go hand-in-hand in pre-planning the construction project. It also appears that more work needs to be done to imbed productivity analysis features into the software.
Overall, the faculty felt that BIM could be an effective tool for teaching productivity analysis because it provides the amount of work and time needed to calculate productivity. However, calculating productivity may be easier if those analyzing the BIM for productivity information helped create the model.
The Student Perspective
The student team members concluded that Building Information Modeling was most beneficial for visualizing the overall project and seeing the construction sequences. The students also felt the BIM was a good tool for improving estimates, schedules, interferences, and overall project management. One student felt that BIM had the potential to be very effective in analyzing productivity. When asked to analyze productivity using the BIM, the students seemed to focus on crew productivity, not overall project productivity and therefore overlooked the fact that the BIM actually contained the necessary information to analyze project productivity, i.e. quantity and time information.
The majority of the students surveyed felt that the BIM did not provide the necessary information to analyze productivity. This perspective is due to the misunderstanding that the Building Information Model actually did contain the quantity of work and time information required. It just was not obvious to first time users. On another note, one student felt the only information BIM did not provide was safety information, but he believed it could be integrated.
Eventually, most of the BIM team members realized that the 3D model was attached to a project schedule, which would enable them to calculate productivity if they assigned crews and compare it to standard productivity rates from R.S. Means, or company historical data. When they actually assigned the necessary crew information, they were able to determine a ‘hypothetical’ productivity, which could be compared to standard productivity rates.
The Industry Perspective
The use of Building Information Modeling in the construction industry is becoming increasingly apparent. Such companies as Webcor, DPR, and Walt Disney Imagineering have used BIM to streamline project management, improve the project schedule, and increase overall productivity. DPR used BIM to win two major expansions and one new hospital construction. They were able to demonstrate to their clients that they had the best approach for keeping 24/7 operation of the hospital during construction. Webcor used BIM as an estimating tool for doing quantity take-offs. They found they could take off a project’s quantities in less than half the time that it would take to do it from 2D drawings. Walt Disney Imagineering used BIM to plan the construction of the Paradise Pier portion of their California Adventure. They were able to reduce unplanned change orders by 40% to 90%, increase productivity, and improve their schedule and overall project management (Fischer & Kunz, 2004).
A recent project in Santiago, Chile is the Temple of Light that broke ground in 2005 and will be completed by 2008 (Steen, 2004). Gehry Technologies was able to create a final computer model for this project that assisted them in solving structural problems with the complex steel and alabaster stone building. At this time, BIM is still a cutting edge tool. A few forward thinking construction companies have decided to invest in this promising new technology. Some day in the not too distant future it will be a widely accepted technology for the construction industry.
Conclusion
The study team encountered several problems in conducting this activity. They also learned several valuable lessons that will affect future implementations of BIM in the classroom. The following is an overview discussion of the problems encountered, lessons learned, and solutions proposed during this study:
Problems Encountered
Inexperience of the students with BIM software. Students were frustrated by the lack of BIM software-related instruction. Students came to this lab assignment with little or no BIM experience.
Steep learning curve for BIM software. It is not easy to learn and apply BIM software in one semester. This complexity dealt many students a set back in completing the lab assignment effectively.
Lack of BIM trained faculty and lab assistants. The BIM software was available in the lab, but there were minimal trained faculty and lab assistants available to help the students.
Student confusion about the assignment. The students were not sure what to expect from the BIM software. They were also learning about productivity at the same time they were learning about BIM software. It was hard for them to keep everything straight.
Lessons Learned
State the purpose of the lab assignment more clearly. Introduce the learning objectives at the beginning of each lab. This will give students a frame of reference within which to work. Repeat the learning objectives often.
Clearly define and limit the scope of work for the lab assignment. Students like lots of structure. Give them this structure through well-defined lab assignments.
Break the lab assignment into smaller incremental components. From the student’s perspective this allows them to absorb smaller increments of the subject material, which gives a good foundation for later assignments.
Emphasize the value of the lab assignment to the student’s education and career. Relate each assignment to a specific task they will be doing in the field.
Ask leading questions that empower and encourage exploration and experimentation. Continually interact with the students by asking those questions that challenge them to think. Don’t just provide answers. Help students discover the answers.
Solutions to Make BIM an Effective Teaching Tool
Organize the overall assignment into several, smaller written lab assignments. This improvement embeds more structure in the overall activity. It gives students smaller incremental goals to accomplish and a sense of achievement when they do complete the lab assignments.
Require the students to turn in milestone reports and project work throughout the semester. This refinement reinforces a greater sense of progress in the student. It also allows the instructor to check that the students are on track and redirect their efforts if necessary.
Provided mini-workshops on specific topics related to applying the BIM software to productivity analysis. In one semester do not try to make students experts in BIM software. Focus on three to four specific BIM topics that relate directly to productivity analysis, i.e. quantities, schedule, sequencing, and visualization.
Separate “learning BIM software” and “applying BIM software” into two courses. Do not allow students to take them concurrently. This improvement will greatly reduce the frustration level for the student.
Staff the lab with trained lab assistants. By continually improving the level of BIM training for faculty and lab assistants many of the “early adopter” problems can be mitigated.
Conduct more group discussions on the lab assignment. Faculty need to lead group discussions to get students thinking about the assignment, solutions to their problems, their experiences, and their results. Relate it to the lecture material on productivity analysis.
Provide support materials, i.e. assignment examples, sample solutions, etc. Show the students examples of what you expect them to accomplish.
Overall, the study team concluded that many of the problems experienced and documented in this study relate directly to circumstances encountered in the early adoption phase of new technology implementation. These problems can be effectively mitigated by the proposed solutions listed above. With continual incremental improvements to the lab assignment, the model, supporting materials, and further training of faculty and lab assistants, a Building Information Model will prove to be an effective, untapped resource for teaching productivity analysis.
Building Information Modeling will continue to transform not only construction education, but also the construction industry. “By 2015, CIFE member companies will have designed three major AEC projects within a year and constructed them within “six months”.” (CIFE, 2004). The advantages of using BIM far out weigh the disadvantages. Not only does a BIM provide excellent visuals, but it also identifies interferences quicker than the human eye. It improves accuracy in quantity take offs and allows the user to improve their schedule and link it to a 3D model. It allows multiple users to edit and change the project model from different locations. It enables the user to calculate and analyze productivity during the pre-construction phase. This ‘hypothetical’ productivity can then be compared to the actual productivity and the user can adjust crews as needed once actual construction begins.
References
Architects and Building Engineers Realize their Ideas Faster Using the Next Generation of Autodesk Software Purpose-Built for the Building Industry. Ed: Product News Network, April 2005. http://global.factiva.com/en/arch/print_results.asp
Bordenaro, Michael. Intelligent modeling makes inroads into real-world practice. CADalyst, January, 2005.
Clayton, Mark J., & Parker, Thomas W. and Warden, Robert B. Virtual Construction of Architecture using 3D CAD and Simulation. October 25, 2001. Dept. of Architecture, Texas A&M University.
CIFE, September, 2004. Measurable Breakthrough 2015 Goals. http://www.stanford.edu/group/CIFE/Mission/mission.html
Fischer, Martin, & Kunz, John. The Scope and Role of Information Technology in Construction. CIFE Technical Report #156, February 2004.
Hunt, Clive. eArchitect: Revit Finally Comes of Age. Building Design, March 2005. http://global.factiva.com/en/arch/print_results.asp
Kelsey, John, & Winch, Graham. What do Construction Planners Do? International Journal of Project Management, February 2005 Vol. 23, Issue 2.
Koo, Bonsang, & Fischer, Martin. Feasibility Study of 4D CAD in Commercial Construction. Journal of Construction Engineering and Management. July/ August 2000.
Steen, Karen E. Temple of Light. Metropolis Mag.com, July 2004. http://www.metropolismag.com/cda/story.php?artid=484
Thabet, Walid Y., & Waly, Ahmed F. A Virtual Construction Environment for Preconstruction Planning. May 28, 2002. Dept. of Building Construction, College of Architecture and Urban Studies, Virginia Tech.