-
- A Comparative Analysis of Financial
Statements of General Contractors
-
- Syed M. Ahmed, Ph.D., Weihua Mao, Aarti Pandit, and Juan Zheng
- Florida International University
- Miami, FL
-
-
Construction companies are shown by noted
agencies to have an alarming rate of business failures and bankruptcies. As
most construction companies are involved in large amounts of investments,
there are huge financial risks involved in these projects. The importance of
sound financial management of these mega-scale projects and the companies
executing such projects should not be under-estimated. In order to stress the
importance of financial management in the construction industry, two companies
were selected for this study. Certain relevant ratios were then selected for
carrying out a detailed ratio analysis. In addition, weights were assigned to
selected ratios, depending on their importance, to arrive at a single final
value for each company through simple mathematical calculations. Final
conclusions are then drawn accordingly.
-
-
Key Words:
ratio analysis, financial statements, construction companies, general
contractors, financial risks.
-
-
- Introduction
-
- Data from
noted agencies like Dun & Bradstreet, the Surety Information Office and the
Centre to Protect Worker's Rights, have shown that construction companies have
an alarming rate of failure, perhaps more so than companies belonging to other
industrial sectors. The basic function of these construction companies is to
execute and manage construction projects, a majority of which are on
mega-scales, involving capital investments in millions and billions of
dollars, and requiring several years for completion and return of investment.
Hence, the financial risks involved with these projects, which get transferred
to the companies working on them and from them onto the financial institutions
or private parties funding them, are tremendous. The overall management,
planning, design and construction aspects of these projects become critical,
wherein even small mistakes can lead to heavy losses. Hence, the importance of
sound financial management of these projects should never be under-estimated.
-
- Construction
projects range from infrastructure projects (e.g. water supply, electricity
and sanitation networks, dams, electric and thermal power plants, nuclear
reactors, etc.) and transportation projects (e.g. road, waterway and railway
networks, tunnels, bridges, harbors and airports) to residential and
commercial construction projects. Good financial management, implications of
the related decisions and the skills required to successfully complete
projects on time, within budget and with sufficient profit, can be best
understood from the financial statements of companies dealing with especially
large projects, in which small differences in financial ratios can translate
into extremely large variations in the actual amounts pertaining to any
account. Hence, it was deemed beneficial to select the financial statements of
two of the bigger general contractors in the country, in order to carry out
the financial analysis.
-
- A comparison
can be made between, the financial statements of a given company and the
industrial averages for companies in the same industrial sector or for all
companies in general, the same company for two different fiscal years, two
companies in the same fiscal year, etc. The objective of this paper is to
compare the financial statements of two general contractors for the same
fiscal year. The value of a financial ratio will reflect the concerned
company’s performance in a given market and other external conditions. By
selecting financial statements of two companies for the same fiscal year, the
authors can assume that the market and other external conditions faced by
these two companies are similar and can therefore interpret these ratios as a
result of the companies' performances in response to these external
conditions. The companies selected by the authors for this analysis belong to
the same industry i.e. the Construction Industry. However, they do belong to
different industrial sectors. The authors are, therefore, also able to
ascertain that the way a company handles its assets and liabilities to
generate profit, is based on the characteristics of the industrial sector that
the company belongs to.
-
-
- Background of the Companies
-
- Granite Construction Company – GC
-
- Granite
Construction Incorporated is the parent company of Granite Construction
Company, one of the nation's largest heavy civil contractors and construction
materials producers. Incorporated in 1922 and publicly traded since 1990, it
is a member of the S&P 400 Index. Granite Construction Company serves both
public and private sector clients and is comprised of many well-coordinated,
highly professional teams of Builders located across the nation. GC are best
known for transportation infrastructure projects including roads, highways,
tunnels, bridges, mass transit facilities and airports. The company also
produces sand, gravel, ready-mix and asphalt concrete and other construction
materials. Unusual among large contractors, GC is equally effective at
building through its two operating divisions, the Branch Division (BD) and the
Heavy Construction Division (HCD). HCD is a major user of construction
equipment and has developed substantial expertise with large, complex
projects. The branches draw on these resources, which are generally not
available to smaller, local competitors. Conversely, the BD offices have
greater knowledge of local markets and provide HCD with valuable information
regarding larger projects in their respective areas, as well as providing a
source of aggregates.
-
- Centex Corporation – CC
-
- Centex
Corporation is the nation's premier company in building and related services:
Home Building, Home Services, Financial Services and Construction Services.
Established in 1950 in Dallas, Texas, with revenues exceeding $10 billion,
Centex is a Fortune 250 company traded on the New York Stock Exchange under
the symbol "CTX." Centex consistently ranks among "America's Most Admired
Companies" in its industry, according to FORTUNE magazine. The company has
approximately 17,500 employees located in more than 1,500 offices and
construction job sites across the nation and in the United Kingdom.
-
- Both these
companies are very big and comprehensive construction companies. However, both
focus on different types of construction projects. GC has more emphasis on
heavy infrastructure projects and construction materials production.
Comparatively, CC has more experiences on home building and construction
services. This difference will be considered in analysis and conclusions.
-
-
- Methodology
-
- Instead of
selecting the Financial Statements of small-scale General Contractors, two
premier construction companies Granite Construction Incorporated (GC) and
Centex Corporation (CC) are selected to find out what results can be expected
as normal, for companies in the construction industry, who are financially
sound or doing well. These companies are well-reputed and work on
mega-projects. Hence, their Financial Statements would be similar to what can
be considered as normal financial statements of companies in the construction
industry and hence will not give skewed results in the financial analysis.
-
- The Annual
Reports of the two selected companies, both in the same Form 10-K format, as
required by the United States Securities and Exchange Commission are used for
easy comparisons. These reports include the following financial statements,
Consolidated Balance Sheets, Consolidated Statements of
Income/Revenues/Earnings, Consolidated Statements of Stockholder’s Equity, and
Consolidated Statements of Cash Flows.
-
- The ratios
used for financial analysis are ratios specific to the construction industry.
The source for these ratios is Dun & Bradstreet, Inc., Industrial Norms and
Key Business Ratios One Year - Desk Top Edition. A financial analysis for a
specified fiscal year (GC-December 31, 2002 to December 31, 2003 and CC- March
31, 2003 to March 31, 2004) is carried out. There is a 3 - month lag between
the selected fiscal years of the two companies, due to a difference in their
financial policies. Since three-month escalation will not affect a company’s
ratio except the absolute value, this minor difference will be ignored for
convenience in comparison of the two companies, thus assuming that the two
sets of data correspond to the same fiscal year.
-
- If two
reports from two different time periods were selected, it would be difficult
to compare them, as the values recorded in these reports could have been the
result of very different market conditions. Using the financial reports of two
companies for the same time period, the results of their ratio analysis can be
used to indicate the companies’ performances in response to these external
conditions for the sake of comparison between them. All values, including
those from the balance sheet, have to be taken for a certain period and since
the balance sheet corresponds to an instant in time, the value from a balance
sheet entered into this ratio must be the average of the corresponding values
on two balance sheets i.e. that for the Start of the concerned Fiscal Year
(GC- December 31, 2002 and CC- March 31, 2003) and that for the End of the
concerned Fiscal Year (GC- December 31, 2003 and CC- 31st March
2004). The values from the income Statement correspond to the same period as
the selected fiscal year (GC- December 31, 2002 to December 31, 2003 and CC-
March 31, 2003 to March 31, 2004).
-
-
- Financial Ratios
-
- Financial
ratios are used to analyze the financial statements of the two companies. A
financial ratio is a ratio obtained by dividing one category or group of
categories on the given company's financial statement by another category or
group of categories on the same company's financial statement (Peterson,
2005). The ratio is expressed as a ratio to 1 (e.g. 0.2:1) or as a percentage
(e.g. 20%) or as the number of times an event occurs during a certain period
(e.g. number of times a company turns over its working capital). The financial
statements most commonly used for this analysis are the company’s balance
sheet and income statement. Although for some analysis, Statements of
Stockholder’s Equity and Statements of Cash Flows are used as well.
-
- Over a period
of several years, data collected from the financial statements of several
companies from each industrial sector has been analyzed in order to prepare
target ratios for each industrial sector. Corresponding to each sector,
statistical data analysis has also provided a median value and a range for
each ratio. This ratio enables the interpretation of the relationship between
the various values shown on the financial statement and to draw appropriate
conclusions from the same. The authors compared different ratios for these two
companies, obtained from calculations from its financial statement, with the
standard value for that ratio for the corresponding industrial sector. From
this comparison, several conclusions regarding the company's financial health
were drawn.
-
- Financial
ratio analysis will help the financial manager of the company to identify a
potential financial problem in the company before it becomes a crisis. It can
help handle simple planning issues, for example, setting aside funds to
account for the depreciation of a company asset, such as equipment, in order
to enable purchase of its replacement at the end of the life span of that
asset. It can also provide insight into the company's ability to pay bills,
efficiency in utilizing its financial resources, profitability, capital
structure of the company, as well as assist in analysis of other basic
business/financial functions.
-
-
- Analysis of Data
-
- Financial
ratios measure different aspects of a firm’s financial status. For better
comparison, ratios are analyzed in four major categories, liquidity ratios,
capital structure analysis, activity ratios, and profitability ratios.
Liquidity ratio measures the ability of the firm to pay its obligations as
they come due. Capital structure analysis measures a company’s ability to
manage debt and demonstrates the way a company has chosen to finance its
operations. Activity ratios measure how effectively a firm is using its
assets. Profitability ratios measure the ability of the firm to generate
income from operations and thus increase the equity (Jackson, 2002).
-
- Liquidity Ratio
-
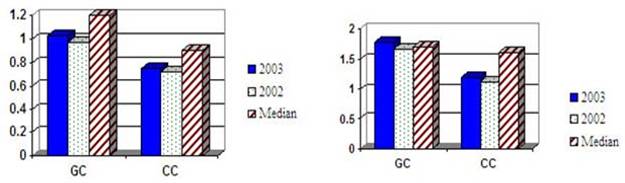
- Quick
Ratio & Current Ratio
[See Appendix “Ratio Analysis Table”]
-
- The quick
ratio and current ratio reflect the company’s ability to pay current
(short-term) liabilities, i.e. its short term liquidity. In 2003 and 2002,
GC’s Quick Ratio was 1.03 and 0.97 respectively, while CC’s was 0.75 and 0.72.
GC’s Current Ratios was 1.77 and 1.67 in 2003 and 2002 respectively, while
CC’s was 1.19 and 1.12.
-
- Fig. 1 shows
that both GC’s and CC’s quick ratios are slightly below the corresponding
medians for their respective industrial sectors. The quick ratios of GC in
2002 and CC in 2003 and 2002 were lower than 1:00 to 1, which means they were
both not liquid enough. Nevertheless, their quick ratios were well within the
range. Fig. 2 shows that both companies have the ability to pay current
liabilities because their current ratios are higher than 1.00 to 1.
Furthermore, GC’s current ratios in 2003 and 2002 were almost the same as the
typical current ratio for heavy and highway companies. It increased from 1.67
in 2002 to 1.77 in 2003. CC’s current ratios were lower than those for a
typical single-family residential company not only in 2002, but also in 2003,
but within the range. Although CC did some improvement from 2002 to 2003 for
its short term liquidity, its current ratio was still not very good. According
to their current ratios, GC performed better than CC. CC was probably
undercapitalized and could have run into financial problems during the next
year as its ratios were below 1.50 to 1.
-