![]()
![]()
![]()
- ASC Proceedings of the 40th Annual Conference
- Brigham Young University - Provo, Utah
- April 8 - 10, 2004
|
|
|
Impact of Local Government GIS Policies to the Construction Industry
Jacob Whiting and Anoop Sattineni
Auburn University
Auburn, Alabama
Geographical Information Systems (GIS) have become common place in many industries. Future construction process will be surrounded and affected by GIS in several ways. Governments and cities are using them in most of their regulatory affairs, developers and certain architects also use these systems. The combination of GIS, Global Positioning Systems (GPS) and handheld computer technologies are changing government policy that in turn is affecting the construction process. In certain parts of the United States, government policies have put GIS on the construction jobsite and into the construction process. The authors predict this to be a growing trend in many parts of the country and may eventually become an industry standard to have GIS as part of the construction process. This study looked at the local government policies of three cities that are at different levels of GIS implementation. Local governments that require “as-built” construction drawings may soon require the same in GIS compatible format. This paper discusses the impact of local government policies to the construction industry and discusses the possibilities of making the transition least painful to all parties concerned.
Key Words: Geographical Information Systems (GIS), Global Positioning System (GPS), Surveying, City Governments, Policies, Handheld Devices, Construction.
Introduction
Background to GIS and GPS Technologies
In 2001, an article appeared in Computerworld Magazine titled “Geographic Information Systems (GIS): More Than Just a Map”. It was an interview with Nancy Tosta, who has had more than 25 years of experience in GIS. Her predictions were that soon, GIS data would be collected at the “point of transaction” rather than as a “secondary process”. She illustrated the example of a building permit being issued and the location of the project being “collected and referenced to the characteristics of the construction” immediately. GIS data collection would eventually become a collection process done in “real time”, and the actual monitoring of the GIS would be of reality, not the “cartographer’s interpretation of reality”. In regard to the quality of GIS accuracy, she commented that “Global Positioning Systems (GPS) can provide more accurate geographic referencing” and that “these tools are increasingly being used as inputs for GIS data, which will help with data accuracy” (Lais, 2001).
What exactly is GIS? GIS has to do mainly with geography and the three W’s: What is where, why is it there, and why do we need to know? GIS is often referred to as “Smart Maps” (GIS.com, n.d.). These maps have specific data affixed to a certain geographical location. One type of data is then associated with a layer map that can be placed on top or under another layer map that represents different data for the same geographical location. These many layers of maps that are associated with the same geographical area or points share “alike features” (GIS.com, n.d.). This allows them to be superimposed on top of one another and line up so that a geographical area can have many different types of data associated with the correct location.
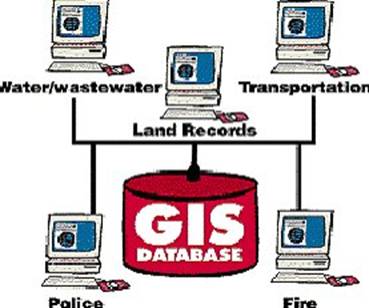
Many industries, government bodies and agencies are developing their own geographic information systems. These are beneficial in their individual management of a given jurisdiction and geographical boundary. The real strength of GIS is the ability to link many systems together so as to share data, such as demonstrated in Figure 1. This allows systems to access and include information that otherwise would be difficult in acquiring. The overall goal of GIS is to eventually have all system data available to share among all parties to enhance the value of information available to the users.
|
|
|
Figure 1. Collaboration and sharing of data from multiple agencies (GIS.com, n.d.). |
GIS policies of city government agencies, such as public works and community development, are affecting the construction industry and the construction process. The use of GIS is so prominent among government agencies, that even the smallest of cities is using these systems. At the current rate and trend, eventually most cities and towns will tie into the county systems, which will in turn tie into the state systems, which will in turn tie into a federal system. This will provide valuable information that is in a variety of accessible systems.
Why do cities invest so much of their time and money into developing a geographical information system? Governments use GIS because it is information to them that is expandable, compressible, transportable, diffusive, sharable and a substitute for other resources (Masser, 1998). To government agencies, GIS is a technological, administrative and policy making resource (O’Looney, 2000). It is both a commodity and an asset. In some regards it is beyond a commodity, it is a necessity in administrative policies. A GIS turns ordinary data into visual information for planning and managing growth. Earlier, spreadsheets or database tables would be studied to determine city planning and management. Now that the same data is displayed on a map, the information is much more interpretable and useful. GIS is also an organizational tool for all of a city’s data. This information, as discussed earlier, resides in each department’s system, but the more interconnected the systems are, the more information is available to the user. GIS shared information will continue to expand from single city departments to the common collaboration of multi-department GIS. Many departments within a city may exist, all needing different geographical data. However, they work for the same goals, and GIS is assisting them in bridging together their resources. Governments will continue to increase their usage of geographical information systems in promoting efficiency, equity, community viability, environmental quality, education, health and safety, public services and social services (Greene, 2000).
One type of data collection that is apparent in the construction process is survey work. Surveying process collects important information about new construction locations, such as infrastructure, building layout, and site layout. The technology associated with surveying is also progressing at a rapid rate in conjunction with GIS. Most advances in this field have been in GPS surveying. GPS surveying collects digital data which integrates easily into the GIS. Several cities view this type of surveying as an efficient, accurate, and viable source of data collection. Some cities are even starting to require GPS surveying in lieu of traditional surveying techniques.
The GPS system comprises of three segments, the space segment, the control segment, and the user segment. The space segment is a 27 NAVSTAR satellite system orbiting the earth. These satellites orbit at approximately 12,000 miles, or 20,000 kilometers, above earth (USACE/NOAA, 1997). Each satellite orbit period is about 12 hours. Of the 27 satellites, 24 are operational and 3 are on reserve. Each satellite is equipped with an atomic clock that keeps very precise time, which is used in the calculations to determine GPS coordinates (Steede-Terry, 2000). The control segment consists of 5 GPS monitoring stations at different locations on the earth’s surface. These monitoring stations transmit correctional data to the satellites to maintain precise timing in the atomic clocks (USACE/NOAA, 1997). It is important to keep the satellite clocks as precise as possible, considering a 1/100th of a second timing error could result in a 1,860 mile GPS coordinate misreading. The monitoring stations are located in Hawaii, Ascension Island, Diego Garcia, Kwajalein, and Colorado Springs. The user segment consists of the receiver types used, which can be categorized into three types. These are geodetic, which is for surveying and is millimeter to centimeter accuracy, mapping, which is centimeter to a few meters accuracy, and general navigation, which is a few meters accurate.
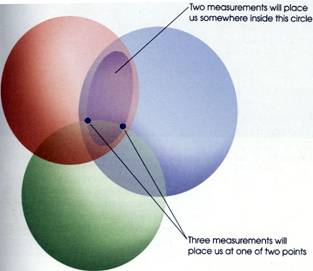
GPS is a fairly simple concept. The signals given from the 24 satellites in orbit are measured in a length of time with code. The time difference with the same code between satellite and receiver calculates a measured distance, using the familiar equation of distance being equal to time multiplied by velocity. A GPS receiver needs to receive broadcasted signals from 3 satellites simultaneously. This is known as trilateration and is illustrated in Figure 2. These three signals are calculated together to give a location on the earth’s surface. However, a fourth satellite is needed to accurately pinpoint the general location of the user and GPS receiver (Trimble, 2002).
The most recent combination of handheld and GPS technologies is a collaborative effort by Trimble Navigation Limited, Environmental Systems Research Institute (ESRI), and Pocket PC PDAs. Trimble has developed a Pocket PC PDA with a GPS receiver called the GeoExplorer GeoXT. The built-in receiver has sub-meter accuracy. ESRI has developed software for Pocket PCs, called ArcPad, which integrates with its desktop GIS software. This allows users to put GIS maps and information on a handheld, go to the field, use the GPS receiver to locate, acquire, edit, and create new data. This data is then put back into a GIS to update the system.
|
|
|
Figure 2. Trilateration of three satellite signals pinpoint one of two locations of a GPS receiver, a fourth signal will pinpoint the correct of these two locations (Steede-Terry, 2000). |
Current Policies on Survey Data in Construction
When a development or new construction project is in the making, after the design, an owner will hire an engineering firm to produce the project drawings. The engineering firm will either hire a surveying firm, or use their in-house survey crew, to go to the site and survey the building layout, site layout, or entire development boundaries along with lot boundaries. These survey data coordinates are then put into CAD drawings. Drawings are then printed and submitted to the city for approval. For a building permit to be issued, all a contractor needs to do is usually submit an address and project information. The survey data is already available at the city on the drawings that were produced in CAD.
After a project is built,
the contractor is then in charge of collecting the as-built drawings.
Once drawings are updated and returned to the contractor, they are usually sent
to the engineers again to update the CAD drawings. Survey wise, the new
construction is surveyed so as to locate utilities, infrastructure, building
layout, property boundaries, setbacks, etc. as they have actually been
constructed on the site. This survey data is also updated into the CAD drawing.
Once the as-built drawings are completed, they are submitted to the city again,
usually as a requirement for the Certificate of Occupancy. The city then uses
the as-built information for its management, maintenance, and historical
information purposes.
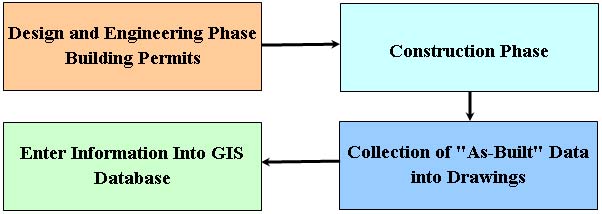
The problem with CAD drawings and GIS data is that, though they are complimentary in some ways integration of the data in both programs is a difficult thing and is not available in commercially available software. This does not allow the contractor, or responsible party, of the initial drawings and as-built drawings to simply hand over a CAD file and have it integrate into the city’s GIS. There is a gap in the information that a CAD drawing contains, and what actually makes it into a city’s GIS. Much information is either lost or is not transferable, that could otherwise be useful for a city in its management and maintenance programs. If this data is gathered through a GPS survey unit, the data easily integrates into the city’s GIS. Currently when as-built drawings are submitted to the city, the city then sends their survey crew to verify locations of certain infrastructure on a site with their GeoXT GPS handhelds. This data is then integrated into the GIS. CAD drawings are put into a city GIS as an attachment to a specific site. In other words, the CAD drawing may be converted to a PDF format, where it is attached to a specific location that users can access through GIS. However, much data still does not make it into the system from CAD. Figure 3 depicts the construction process displaying the point at which GIS data is collected.
|
|
|
Figure 3. Survey data collection flow throughout the construction process at the present. |
Cities find a dilemma being that they would like the entire initial survey data locating infrastructure to integrate into their systems, followed by the as-built information which would update the current information in the system. Cities do not have the sufficient manpower or money to accomplish this. There is usually too much growth taking place, plus trying to gather data from older projects and the rest of the city. That leaves cities with only a few options if they would like to stay on top of GIS data collection. One, they can slowly gather at a rate their current manpower can afford, or two, they can shift the responsibility of gathering the GIS data to the parties involved in the construction process. The latter appears to be the direction of choice for many cities, by the use of GPS technology, through policies that create the responsibilities for the parties involved in the construction process.
Methodology
The GIS policies of three cities were examined as a part of this study. City officials from these three cities provided the information in separate interviews. The officials included City Engineers, Planning personnel and GIS managers. The three cities chosen were Auburn in the state of Alabama, Boulder and Broomfield, both in the state of Colorado. Auburn and Broomfield are cities with a population of around 40,000 people, while Boulder is home to around 120,000 people. The selections were based to represent the adoption of GIS technology by cities of varying growth rates in the United States. The authors attended the ESRI annual conference in 2003 and based on preliminary interviews with GIS software providers, the authors choose the three cities. Broomfield has a growth rate of 4.5% and Auburn has a growth rate of 2.26% while Boulder has a growth rate of 0.71%. These three cities represent growth rates that are high (Broomfield), medium (Auburn) and low (Boulder). This comparison is assumed to be valid only within the context of this study.
During preliminary investigation the authors felt that these cities also represented the various levels of GIS adoption rates. The authors felt that Broomfield was very aggressive in adopting GIS technology and that new technology was guiding the policy making process of the city. Auburn was found to be not as advanced in adopting new technology as Broomfield but was making fast progress. Boulder was the largest geographical region studied and much of their GIS implementation was used in managing the cities natural habitat. At the time of this study, both Boulder and Auburn were examining their respective GIS policies with regards to the construction process.
Questions and areas of topic focused on what type of survey data cities were requiring for the different stages of the construction process, namely whether it was mapping or survey grade accuracy. Another was whether the city was requiring, requesting, or even asking for GPS survey data, and whether or not it was a goal of future policies and procedures. A comparison of traditional survey methods and new technological methods using GPS and handhelds was also addressed. The affect of the various GIS policies on the contractors, surveyors, engineers, and developers is also addressed in the study. An analysis of the cost of implementing these new technologies is also made, along with their possible drawbacks and benefits.
Limitations of the Methodology
The results presented in this paper are based on the study of only three cities. This is perhaps too small a sample size to draw conclusions that might be considered valid for the rest of the country. The policy making process in all the cities was not the same. Some cities relied exclusively on the GIS managers’ expertise to make policies while others hired consultants to make these policies. One of the cities, Auburn, is a university community with a significant student population. The policy making process in this city is influenced by the university officials and the student population.
Results
All three cities are currently using GPS receivers to gather GIS data. All three of the cities were also using ESRI’s ArcGIS and ArcPad software. Of the two grades of GPS surveying, mapping grade is sufficient for the bulk of the survey data that the cities are putting into their systems. However, some of the property boundaries, water valve locations, and other GIS data are required at survey grade. City requirements vary and the accuracy of the data depends on what the need of each individual city is. Some cities have other ways of importing the data into their system aside from GPS.
A) Interview with City of Boulder, Colorado.
Boulder County and Boulder City work independent of each other, but eventually the county and city systems will be integrated. When Boulder city heard of GPS being used as a means to gather initial survey data for a new project and as-built data, they responded that there are no requirements to use GPS, but they would welcome such data and implement it into their system. The city officials also claimed little new growth or development happening. They do not require GPS surveying from the construction process. However, they are using the GeoXT handheld to gather data for themselves. The handheld is giving them accuracy of sub-meter horizontally, usually within a foot or two, and 1/10th of a foot vertically. Boulder city’s GIS ties in with Boulder County’s systems that in turn tie into the state plane coordinate system. This system is divided into zones that create a high accuracy GPS network that controls standards. Boulder also indicated that the city may consider charging a mapping fee to map as-built survey data at the end of the construction process. Boulder gives setbacks and development specifications that must be surveyed at the beginning of a project. The engineer uses surveyors to collect the layout data, and also the as-built data. This responsibility of gathering the as-built GPS data will probably not be passed on to the contractor. There is a possibility of equipping the inspectors with handhelds similar to the GeoXT to map infrastructure data as the inspections take place. City officials indicated that they would feel more comfortable with their own personnel gathering the data, since it is for their system. They feel that the city inspectors would deliver more accurate GPS data of utilities.
B) Interview with the City of Auburn, Alabama.
Currently, Auburn has two types of GPS units for their GIS data collection, one being survey grade and the other mapping grade. They are currently using the city survey crews to gather utility locations in the ground and other infrastructure. The GeoXT is sufficiently accurate to locate most of this information, including clean outs and centerlines of new roads. Further down the road, when the GIS of all of the city departments starts to tie together, their will be more survey information that will be needed for the GIS. An example of this would be the fire department needing to locate water valves located in or on buildings and lock box locations. Eventually, when they achieve a more advanced state of information gathering from new construction they will require as-built information from construction projects. Currently Auburn sends out their survey crew, and using the GPS handheld, locates much of the as-built information on a new site off of the CAD drawings. City officials also indicated that they may eventually charge a mapping fee to the contractor, who would ultimately pass it on to the owner, for the GPS surveying of as-built information on a site. Auburn considers themselves in a somewhat primitive state with GIS implementation in regards to their future goals. They also plan to post their GIS on the web as an interactive map within the next one to two years.
C) Interview with City of Broomfield, Colorado.
Broomfield requires that all new developments submit GPS survey data in addition to the survey data provided on CAD drawings. The basis of bearing, or coordinates, for all of the GPS survey data is in the GIS land position points that the surveyors have to tie into. It is all done in ground coordinates. The planning department requires that the GPS survey data tie into three GIS land positions located throughout the city. The city currently has 24 survey GIS land positions for tying into with GPS. When the city first started trying to collect GPS survey data, surveyors did not respond. Broomfield eventually made GPS surveying and data submission mandatory. Initially, surveyors did not give much heed to this new requirement. They continued to survey new developments, but did not include the GPS data, only the survey data on the CAD drawings. Once the city started rejecting incomplete information, the developers started demanding the surveyors to provide this data. The surveyors claimed that they had not been paid to GPS survey the site in addition to the survey work they had already done. In the end, surveyors agreed to comply and absorbed the losses from not complying initially. Since then, there have been little problems with fulfilling that portion of the requirements. This GPS survey data is required as survey grade. Survey grade GPS equipment can be very expensive, costing thousands of dollars. The smaller surveyors without GPS capabilities started subcontracting the GPS portion out to other survey shops with the appropriate GPS equipment.
GPS survey data is then converted into the city GIS using desktop GIS software. The key with receiving both digital survey data along with the submitted hard copies from CAD is that they match. There have been instances of discrepancies in the two data submissions not matching up. This is a dilemma in and of itself because the city officials still spend a good amount of time comparing the hard copies to the digital copies. The only way to fix that problem is to switch the submission requirements to be all digital data. The inhibitor in this is the reluctance of other city departments to become that technologically advanced. In essence, a paperless city government would result if Broomfield made digital data as the only requirement. All CAD drawings would be in PDF formats, or something similar and so would the as-built information of the construction projects themselves.
The use of the GeoXT for as-built data is not yet a requirement, though they claim it is on the horizon. The city’s lack of manpower makes it difficult to collect all of the existing data along with the new construction. Though as-built drawings are required by the city, rarely are they complete or finished. To overcome the obstacle of lack of manpower, the thought of passing the GPS as-built gathering on to the contractor has been one alternative. These handhelds make it possible for parties involved in the construction process to easily fulfill this requirement.
Conclusions
The basic trend with GIS is that cities will continue to adopt it. Those that have not done so will most likely adopt GIS soon. Those that have adopted and implemented GIS will continue to expand and develop its applications. It is inexpensive as well as a very effective management tool. The gathering of GIS data will slowly trickle onto the construction site during construction.
Contractors should be aware of this technology and why it is driving cities to implement it and make policy changes that affect the construction process. As cities make the collection of GPS data a mandatory submission, it will affect the construction process of a project. On the front end, it will affect the engineer’s responsibilities as to what they must submit to the developer, who in turn has to submit to the city to build their project. This is already becoming a trend, such as in the case of Broomfield, Colorado. On the back end of a project, as-built information will be required by the city in a GPS digital format. Most commonly the contractor is responsible for the as-built information. Whether the survey portion is passed on to the engineer, who then sends out a survey crew, or done by the city for a mapping fee, or is self-performed by the contractor remains to be seen. However, all cities interviewed indicated that it is a requirement that they are all considering in the future. It will affect contractors in regards to the requirements they must fulfill in order to complete a project. Cities will continue to adopt these technologies, like the GeoXT handheld, as they improve and become less expensive.
Another factor that will determine GIS data gathering requirements is whether a city wants data collected in real time, during the construction process, or at project completion. GPS data gathered during a project is much more likely to be accurate, before utilities are covered. Cities may have their inspectors gather this data in addition to a mapping fee for data collection at the end. This would leave the contractor unaffected by GIS and GPS technologies. However, if a city decides to rest this burden on the contactor, then they must become familiar with the technology so as to self-perform it or effectively subcontract it out. It is apparent that GIS/GPS data collection will take place throughout the construction process, as depicted in Figure 4.
The involvement of the different parties of the construction process in GIS might also influence the policies that cities will make. Being proactive could result in creating positive and beneficial policies that may be advantageous for the construction parties as well as the cities. Otherwise, cities will go forth with GIS policy making, which may not be favorable for the developers, engineers, contractors, or survey firms. Committees could be made combining the major parties with city officials to explore the different avenues available. These committees could bring together the efforts of cities and the construction industry for further exploration into the possibilities of improving the construction process and cities’ management of new construction and growth. These collaborative efforts could also spawn new innovations of GIS and GPS technologies within the construction industry, where little exploration has been made.
Those predictions of two years ago by Nancy Tosta are holding true. Cities will continue to desire more accurate data and to have it at the time of transaction, or rather during the construction process. The construction process of delivering not only a completed project to the owner will also call for the complete and accurate digital data for a city GIS where the project resides. The time to become involved in the development of city GIS policy making and implementation is right now, when most cities and policies are in the early stages of development.
|
|
|
Figure 4. Survey data collection flow throughout the construction process at present compared to future trends. Bold and underlined depict the real time data collection requirements for the city’s GIS during this process.
|
References
GIS.com. (n.d.). Geographic information systems “GIS”. Retrieved May 28, 2003 from http://www.gis.com/whatisgis/whatisgis.pdf
Greene, R.W. (2000). GIS in public policy: Using geographic information for more effective government. Redlands, CA: Environmental Systems Research Institute, Inc.
Lais, Sami. (2001, June 25). GIS: More than just a map. Computerworld. Retrieved on May 27, 2003 from http://www.computerworld.com/softwaretopics/software/appdev/story/0,10801,61565,00.html
Masser, Ian. (1998). Governments and geographic information. Great Britain: T.J. International Ltd.
O’Looney, John. (2000). Beyond maps: GIS and decision making in local government. Redlands, CA: Environmental Systems Research Institute, Inc.
Steede-Terry, Karen. (2000). Integrating GIS and the global positioning system. Redlands, CA: Environmental Systems Research Institute, Inc.
Trimble. (2002, January). Mapping systems general reference. Retrieved May 28, 2003 from http://www.trimble.com
USACE/NOAA Surveying, Mapping, and Remote Sensing Conference. (1997, August). GPS for GIS data collection. US Army Topographic Engineering Center