(pressing HOME will start a new search)
![]()
![]()
- ASC Proceedings of the 23rd Annual Conference
- Purdue University - West Lafayette, Indiana
- April 1987 pp 104-113
|
(pressing HOME will start a new search)
|
|
A SERIES OF LOTUS 1-2-3 TEMPLATES FOR TEACHING GOOD ESTIMATING PROCEDURES
|
Bill
McManus |
|
A
construction pricing and bidding system based on the popular
spread-sheet Lotus 1-2-3 is presented. It uses the full range of 1-2-3's
capabilities to aid the estimator in the organization and preparaŁtion
of detailed estimating and bidding documents. This is done in five
distinct steps: subdivision of the work, calculation of direct costs,
estimaŁtion of indirect costs, assessment of subcontract offers, and
the mark up of the bid. Unlike most
computerized estimating systems, CONEST (the name of this system) is not
based on a data base of unit prices. Material costs must be supplied
from an external source. Labor costs are based on crews and productivity
factors defined by the estimator. Designed to
both teach and implement good estimatŁing procedures, CONEST requires
attention to be given to all significant cost components. It further
aids the instructor in that student estimates are all in the same format
and can be graded by exception with the aid of the program. KEY
WORDS - Cost
estimating, Computer, Lotus 1-2-3, Work package, Work breakdown
structure |
INTRODUCTION
Most
computerized estimating systems are not conducive to the teaching of good
estimating practices. They are based on databases of unit prices and the
critical -part of using these systems is the development and
maintenance of these lists of data. This process is too time consuming to be
undertaken as part of a one semester estimating course. The alternative is to
use a database developed by someone else. In this case the student estimator is
merely supplying his takeoff data to the system which then magically figures out
how much the project is going to cost.
Although
designed to be used in the construction industry, CONEST is suited to the
classroom environment. It is an estimating system that lets the students do much
of the thinking while giving them the tools and the structure with which they
can produce a superior, auditable, and easily evaluated estimate.
This
paper is addressed to teachers of construction estimating. An understanding of
estimating procedures and the use of electronic spreadsheets is assumed.
Description of
the System
CONEST
is an integrated series of menu and macro controlled Lotus 1-2-3 templates
designed to aid both general and specialty construction contracŁtors in the
estimating, pricing and bidding of work.
The
CONEST system is based on Lotus's spread sheet partly because of 1-2-3's power
and partly because of its popularity--there are millions of copies in use.
CONEST is not copy protected and since it is built of standard Lotus 1-2-3
functions and macros, the sophisticated 1-2-3 user should have no problem
customizing the system to suit his unique needs.
Requirements
The
minimum computer system required to run CONEST consists of a MS-DOS computer
with 256k of Random Access Memory (RAM), two floppy disk drives, a printer
capable of printing 132 columns in compressed print mode, and Lotus 1-2-3
version 1-A (or a completely compatible "work alike").
While
CONEST has been designed to work well in this minimum configuration, its
performance and capacity can be substantially enhanced with more RAM, a faster
processor, and/or hard disk storage. CONEST swaps portions of the spread sheets
in and out of memory to get the maximum amount of function out of the minimum
amount of RAM. Even using these techniques only 100 work packages (more than
enough for most student estimates) can be analyzed at one time with the 256k RAM
version. This limitation can be overcome by subdividing the analysis and
consolidating the data on the summary sheet. This is not a complicated process
since it can all be done through menu selections.
Evolution
CONEST
was developed by the author while earning a Masters degree in Construction
Management at Texas A&M University. The first version was a system based on
the work package concept (discussed in more detail in the section on work
breakdown structure) and implemented in Multiplan. This system was developed
under the Microsoft Disk Operating System (MS-DOS) and transferred to Digital
Research's Control Program for Micro Computers (CPM).
The
system consisted of separate spread sheets for each work package which were then
consolidated in a summary spread sheet. These summary data were then combined
with an indirect cost report on a top sheet that provided for adjustments and
markup.
This
early version of CONEST was used by nearly one hundred students to prepare
realistic estiŁmates and bids for several small commercial projects. This
provided the author with the opportunity for considerable testing and analysis
of the strengths and weaknesses of the system.
Three
major weaknesses were identified in this early version of the system. First, a
moderate level of skill in the use of Multiplan was needed to build an estimate.
Second, the process was relatively slow due to its implementation in CPM and to
the way summary information was developed using Multiplan's file linking
capability. Third, subcontracts were included in the work packages making it too
time consuming to effectively deal with additional sub contracts in the last
minutes before a bid was due.
After
careful consideration of the processes involved, a decision was made to rewrite
the system in Lotus 1-2-3. This was done primarily so that the macro capability
of Lotus could be used to simplify and speed up the process.
This
new version required a complete restructuring of the system. Instead of using
the file linking feature of Multiplan, summary data are exported from each work
package as it is defined. This creates a data base that grows with each additionŁal
work package and gives the estimator a running total of his direct costs as he
goes.
THE
CONEST MODULES
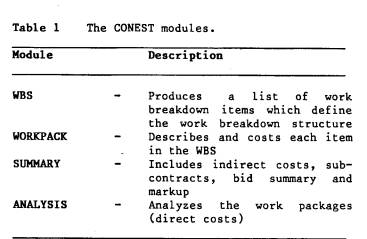
The
CONEST system consists of four main modules which are accessed through an
umbrella module named CONEST. The four main modules are listed in Table 1.
Work
Breakdown Structure (WBS)
The
first step in preparing a construction estimate is the subdivision of the work
into manageable activities. In the CONEST program, each of these activities is
called a Work Breakdown Item (WBI). The list of WBIs that define the job is
called the Work Breakdown Structure (WBS).
|
|
Organization
The
estimator should designed these WBI's so that the same item can be used for
material quantification and pricing, estimating level of effort, scheduling, and
cost control.
"Each
[Work Breakdown Item] is composed of like activities with similar productivity
factors, has a defined beginning and end, is under the supervision of one first
level manager (foreman), and can be objectively measured for progress
reporting" [1].
The
structure required to most efficiently quantify the material requirements is not
necessarily the same as the structure needed to most efficiently schedule the
work or measure the level of effort. Compromises must be made so that the same
WBIs can be used throughout the life of the project. This not only keeps the
estimator, scheduler and cost accountants from duplicating the others work, but
also allows for meaningful feedback to be used on this and future jobs.
CONEST
is designed Co encourage this sort of organization. Each work package is limited
to one labor productivity factor, and provisions are made to include scheduling
information in the form of a list of prior work items.
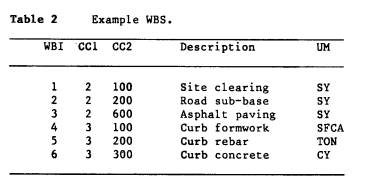
The
WBS module produces a list of the work packages that make up the job. Each work
breakdown item consists of a sequential WBI number, two 3 digit cost codes, a
description, and the unit of measure to be used to estimate the labor
requirements. The following (Table 2) is a brief example:
|
|
Operation
The
system opens two windows. Previously prepared WBSs are imported into the first
window. Items that are needed for the current job are then copied' into the
second window. The system comes with a 199 item WBS based on the Construction
Specification InstiŁtute's Uniform Cost Index (UCI). These items are "Broadscope
section titles" and as such are too general in nature to be used as actual
work breakdown items. They have been included for two reasons. The first is to
serve as an example to demonstrate the macro controlled production of an
"Out-WBS" from an "In-WBS". The second is to serve as a
basis for the assignment of cost codes so that all estimates produced with the
system can be compared and evaluated in the ANALYSIS module.
After
a number of WBSs have been developed and saved, a new WBS can be organized by
combining portions of established WBS files. The system sorts and numbers the
lists automatically. The WBS module can be used to prepare an activity list for
scheduling the job as well as a work breakdown structure for pricing the general
contractor's own work.
Cost codes
The
cost codes can be anything that will help to summarize and track the WBIs and be
reconcilable with existing codes used for accounting or cost control. This
reconcilability is of utmost importance and can be provided for with good cost
codes and a good work breakdown structure [2].
For
simplicity in the examples, the first cost code (CC1) is the major (UCI)
Division and the second cost code (CC2) is the major classification within that
Division. The program is set up to use two 3 digit numbers but can be easily
modified to accept longer numbers. Regardless of the cost code scheme used, it
should be well thought out and used for all estimates produced. In a busiŁness
setting this will allow the analysis and comparison of like items from multiple
jobs. In an educational setting this uniformity of cost codes will allow student
produced estimates to be evaluated by exception. This will increase the accuracy
and detail of the evaluation as well as substantially decreasing the time it
takes to identify and trace errors to their source.
Description and unit of measure
The
description should be brief but adequate to clearly define the item of work. The
program will accept a description up to 255 characters long but most of the
reports will print only the first 24 characters.
The
unit of measure is that unit with which the level of effort will be forecast.
Since the most critical part of any construction estimate is the prediction of
the manpower to be used, the WBIs in the CONEST system are based on this
measure. For example, the unit of measure for the painting of stripes in a
parking lot would be linear feet of stripe as opposed to gallons of paint.
After
the work breakdown structure for the job to be estimated is created, it is
exported for use in the next module--WORKPACK.
Work
Package Generation (WORKPACK)
Step
two in the production of an estimate using CONEST (after defining the Work
Breakdown Structure) is the detailed definition of each WBI. With this module,
the estimator creates work_ packages out of the WBIs by adding specific
quantitative data to the general description given to each WBI in the WBS
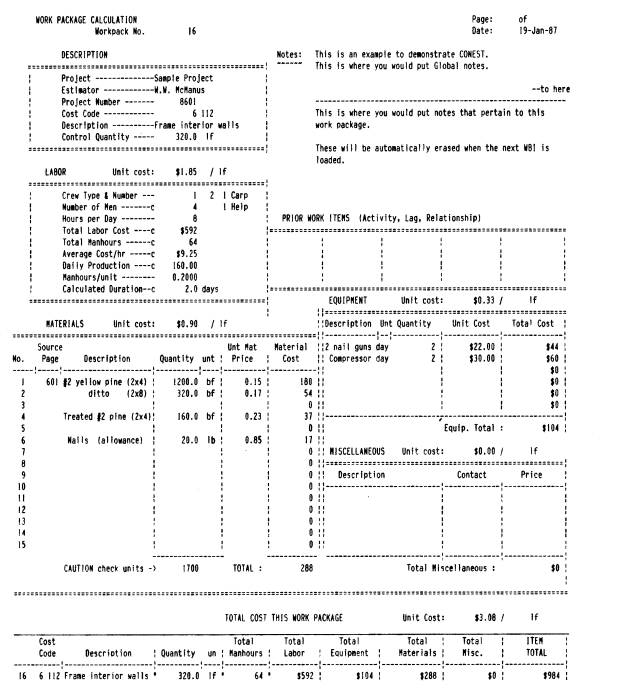
module. This module produces one page reports describing each of the
work
packages. The reports are subdivided into eight blocks: Description, Labor,
Materials, Equipment, Subcontracts, Prior Work Items, Notes, and Total Cost This
Work Package (Figure 1).
Create labor table
The
first thing that must be done to prepare to use WORKPACK is the modification of
the Labor Table to reflect the crews and wage rates applicable to the specific
situation. This labor table is used in the labor cost portion of this module. It
consists of a sequentially numbered list of crews with descriptions, the number
of persons in the crew, and their average wage rates.
The
rates are bare (i.e. without added burden such as payroll taxes or benefits). If
the estimator has already defined crews for the company, these crews should
replace the default crews. If cost data from a commercial source such as R.S.
Means or Dodge Reports are used, the crews on which those data are based must be
used. Crews can be added to the labor table as they are needed.
Importing a WBS
After
preparing the crew table for the current estimate, the work breakdown structure
created in, the previous module is imported into the WORKPACK module. This (as
with almost all operations) is accomplished by choosing an option on a menu.
The WBS is placed in the appropriate columns in the direct cost data base. As each new work package is defined, the program calls up the cost code, description, and unit of measure for the next WBI.
Development of
the work package
The
information is then entered into the work package report (Figure 1). While some
of these data pertain to the project as a whole and will not change for each
work package, most of it will be saved to disk and cleared from the entry form
so the next work package report can be defined.
|
|
|
Figure
1
Workpackage |
Entering
and saving this work package data is done under macro control. This makes the
process go very quickly and is almost fool-proof.
Labor
productivity data is entered as manhours per unit and is immediately displayed
as duration, daily production, total manhours, total cost, and cost per unit.
This allows the estimator who uses historical data kept as manhours per unit to
check the reasonableness of his data. The estimator who does not have access to
historical data in this form can enter different manhour per unit values until,
by trial and error, he gets the production figures that he wants.
Up
to 15 different material items can be included in the work package. The units
can be mixed and are not related to the quantity on which level of effort is
based. A column is devoted to the "source page". This should be used
to show where the material quantities come from, i.e., a page number from the
take-off.
The
unit cost for equipment is usually a rental rate and the unit is a unit of time.
Only equipŁment that can be directly, charged to this work package should be
included at this point. EquipŁment that is used throughout the job can be
included in the indirect costs section of the SUMMARY module.
Miscellaneous
costs are the next to be added. This category is for costs that are directly
attributable to this work package but upon which no material or labor taxes will
be accessed. Examples that fit this category are minor subconŁtracts that will
not be competitively bid or charges such as dump fees.
Notes
can now be added to better explain and describe the work package. Actually,
notes can be added at any time either by hand or with the program. Because this
system produces such neat printed output, most users are reluctant to write on
the reports. It should be stressed that these documents are for internal use and
the better all parts of the estimate are documented the more useful it is.
Save work package and update data base
After
entering the needed data and notes into the work package, the report is printed
and then saved to disk through a menu option. At the same time, the "bottom
line" data are copied to the summary data base that is part of the WORKPACK
module. These data are summarized as each work package is added, giving a
running total of the costs and manhours accumulated.
Subsequent
work packages
The preceding procedure is repeated until all of the work breakdown items have been fleshed out with the detailed information that turns them into work packages. At any time, the estimator can print the data base as a report on his progress to date.
Each
work package uses about 24 kilobytes of disk space. This means that there is
only enough room on a 360k disk for about 15 work packages. This can be a
problem especially if floppy disks are used. A data compression utility such as
SQ. by Turner Hall Publishing, which claims to reduce the amount of disk space
needed by Lotus spreadsheets by 80% to 95%, could do much to alleviate this
predicament.
Save data base
The
last operation necessary in the WORKPACK module is the exportation of the
completed direct cost data base for use in SUMMARY and ANALYSIS modules.
Indirect
Costs, Subcontracts & Markup (SUMMARY)
The
third module in the CONEST system adds to the bid all those costs that are not
part of the direct costs associated with the work to be done by the estimating
contractor. These items include job indirect costs, subcontracts, taxes--both
material and labor, insurance, bonds, home office overhead, and profits.
The
SUMMARY module produces three reports: Job Indirects, Sub Tally, and Markup.
Information is automatically transferred from the indirect and subcontract
reports to the markup sheet. Direct costs are imported into the markup report
through a menu option. The markup sheet is then used as a recap sheet to
summarize the bid as a whole.
Job indirect costs
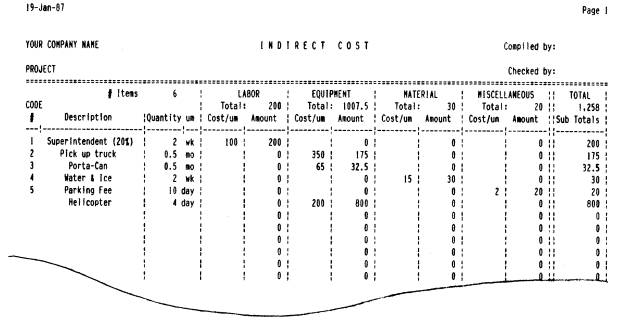
Expected
costs that can be associated with the job but can not be isolated in any one
work package, are recorded in the Indirect Cost Report. This section of the
module works as a classic spread sheet. The estimator enters a description,
quantity and unit, and then the cost per unit of labor, materials, equipment, or
miscellaneous for each item. The miscellaneous category is to be
used for any costs, other than for equipment, on which the contractor pays
no sales tax or labor burden (Figure 2).
|
|
|
Figure
2
Indirect Costs. |
Once this report is completed, it can be saved to use as a starting point on a subsequent similar job. Conversely, if a suitable indirect cost report has already been created and saved, it can be imported into the SUMMARY module and modified to suit the current project.
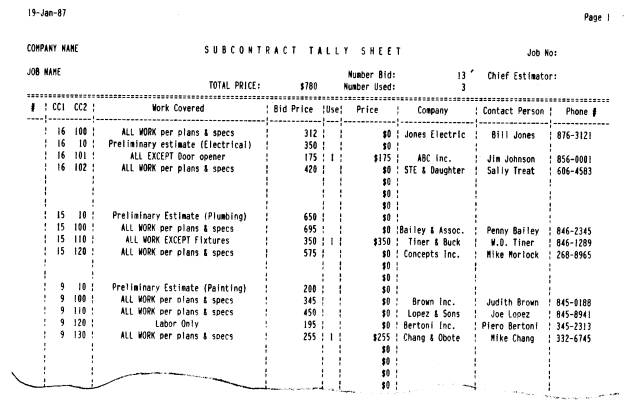
Sub-Tally sheet
As
bids for portions of the job are received, they are entered into the Sub Tally
sheet. The low responsible bids are tagged and only these bids are used in
calculating the prices for the prime bid.
The
general contractor may want to include his own estimates for each of these items
to be sublet. This serves three purposes: as a ballpark figure to predict a bid
price before all the subs are in; as an indication of the reasonableness of the
subcontractor's offers; and as a figure to be used in the event that no
reasonable bid is made on an item of work.
One
of the last operations before the prime bid is made is to verify that the best
price for each item to. be subcontracted is tagged. Even changes that are made
in the last seconds are reflected in the general contractor's markup of the item
(Figure 3).
|
|
|
Figure
3
Subcontract Tally Sheet. |
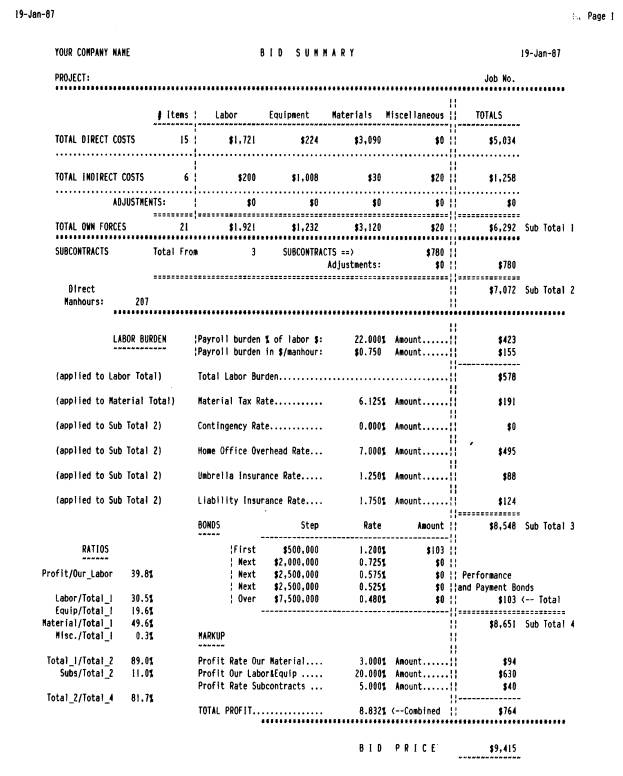
Markup of the costs
The
final report in the SUMMARY module is the Markup Report. This serves as a top
sheet to summarize the prime bid as well as a place to add costs that are
dependent on the items identified so far.
Direct
costs are imported from either the WORKPACK or ANALYSIS modules. If there were
too many work packages to fit into the ANALYSIS module at one time (100 maximum
at 256k), this is the point where these costs can be consolidated.
The
latest indirect and subcontract costs are automatically transferred from the
other sections of this module. Provisions have been made to adjust these
predicted costs at this time. Specific dollar amounts can be added or subtracted
from any category. Adjustments can also be made as a percentage to be added to
or removed from the sub total before markup.
In
addition to consolidation, this top sheet provides a way to markup the costs
with those items that are usually figured as a percentage of job cost. Except
for profit, these percentages usually remain the same from job to job. See figure 4 for an example of this markup report.
|
|
|
Figure
4 Markup Report |
Labor
burden can be added as a percentage of labor cost and/or in terms of dollars per
expected manhour. This is helpful because some burden such as social security is
dependent on labor dollars and some items such as fringe benefits, may be
calculated on manhours worked [3].
Material
taxes are computed as a percentage of the predicted material costs. In states
where a sales tax is assessed on items other than materials, this rate must be
included in the appropriate places.
Performance
and payment bonds are calculated as a stepped percentage of job cost. The markup
sheet includes a small table into which the estimator inserts the steps and
rates used by his bonding company. No provision has been made for bid bonds as
this item is of negligible cost and, if not paid for as a service by the bonding
company, can be included in home office overhead.
At
the bottom left of the markup sheet are some ratios that aid the executive in
determining the amount of profit to put into the bid. These include the ratio of
total profit to the contracŁtor's own labor costs, the ratio of subcontracted
work to that to be done by the general contractor, and the proportions of labor,
material and equipment in the general's work. These ratios are intended to give
an indication of the relative riskiness of the project as well as the makeup of
the job.
Profit
is entered in three parts: as a percentage applied to the contractor's own labor
and equipŁment costs, as a percentage applied to material to be purchased, and
as a percentage of the subconŁtracted work. The program calculates the total
profit as both a dollar amount and as a percentage of these figures.
ANALYSIS
After
creating the work packages that describe the direct costs associated with the
job, the data
base
that summarizes those costs can be analyzed using the ANALYSIS module. Use of
this module is optional. A bid can be prepared using only WBS, WORKPACK, and
SUMMARY.
The
estimating instructor can take the direct cost data from each of his or her
students and compare them in all sorts of ways. This allows for evaluation by
exception. The erroneous data will bubble up to the top and can be tagged for
further scrutiny.
The
first step is to import the direct cost summary to be analyzed. If the detailed
data have been developed by several different people on different computers,
this is a point where it can be consolidated.
The
ANALYSIS module produces three reports: a sorted direct cost summary, an
extracted data report, and a summary by cost code 1 (usually the UCI Division).
This module also creates several graphs that show relationships between the work
packages and categories of costs.
Sorted direct costs
The
first use of this analysis is in checking the estimate for gross errors. The
data can be sorted by any of 13 fields: Project (student), Work package, Cost
code 1, Cost code 2, Description, Unit of measure, Manhours, Labor cost,
Equipment cost, Material cost, Miscellaneous cost, Total cost, and Cost per
unit.
Sorting
the work packages by the appropriate fields helps to determine whether any of
the costs are out of proportion. The sorted reports can be printed under menu
control at any time.
It
is often beneficial, to sort by total cost to see which work packages are most
critical to the price of the job as a whole. This sort will indicate work
packages that might be too insignifŁicant to be separately considered. If this
is the case, the WORKPACK module can combine these insignificant items into
other work packages.
A
sort by manhours budgeted will give an indication of the items that require the
most management attention. This is significant because although there is not
much that can be done about expensive materials, there is a lot that can be done
that affects labor productivity.
This
sorted data report also has a field containing the total cost of each work
package as a cost per unit of the controlling unit of measure. It is not often
useful to sort by this field, but it can be very productive to check these unit
costs against the company's and/or industry historical data.
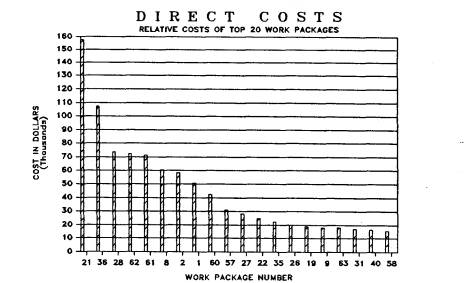
Graphs
The
sorted data base can also be viewed graphically. There are two predefined
graphs: the first shows the proportion of labor, equipment and materials to the
total direct costs (excluding subcontracts); the second shows the relative total
cost of the first forty work packages in the sorted list (see the example in
Figure 5 below).
|
|
|
Figure
5 A
Sample Graph. |
Data extraction
The
second major part of the ANALYSIS module is called "Data-Query" on the
menu. This section produces a report based on information extracted from the
direct cost data base. Criteria are entered under headings that duplicate the
field names in the data base. Any work packages that meet these criteria are
then listed in the DataQuery report and the totals are calculated.
By entering complex criteria such as -- CC1=3 or CC1=5 and Manhours > 1000 or Total cost > 10000 -- the estimator can list very specific data.. In the above example, he would get a list of all the work packages in Division 3 (concrete) or Division 5 (metals) that were estimated to take over 1000 manhours to complete or were expected to cost more than $10,000.
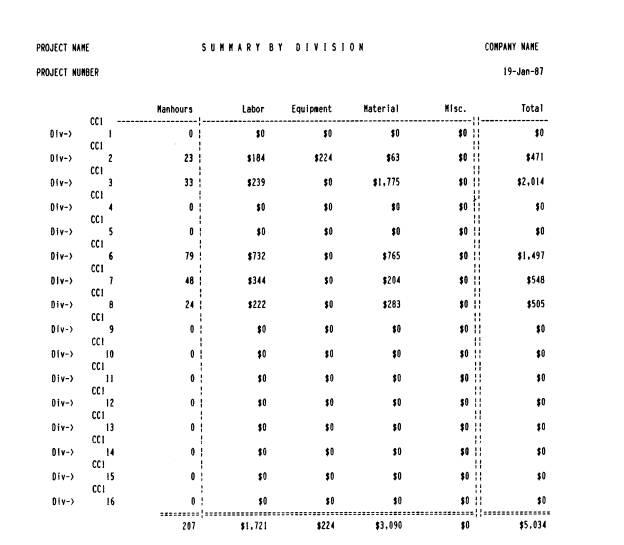
Summary
by CC1 (UCI Division)
The third and last major section of ANALYSIS is a predefined direct cost summary report. In the default configuration, this report is set up to summarize the direct costs by cost code 1 which the author suggests contain the UCI Division. This report can be modified to summarize data by either of the cost codes or a combination of both.
In
this default configuration, the report shows the total Manhours, Labor,
Material, Equipment, Miscellaneous, and Total Costs for each of the 16 UCI
Divisions.
See the example in Figure 6.
|
|
|
Figure
6
Summary by Division. |
USING CONEST IN AN ESTIMATING CLASS
Using CONEST in a class room situation is a little different than using it in a business. The student usually only gets to prepare one estimate and does not have a library of work breakdown structures or work packages to work with. As with most computer programs much of the benefit comes with repetition. It should be pointed out that because this is the first time they are using the system some of their time will be spent setting up the structure and learning the system.
Once
a work breakdown structure and labor table have been created it takes an average
of about five minutes per work package to complete an estimate. This comes. from
the author's observaŁtions of about thirty students who were using the system
for the first time.
Suggestions
I
have had the best results when students, after being given a detailed
introduction to the work breakdown structure and work package concepts,
developed a preliminary WBS and crew table before they did a quantity takeoff.
This way they organized the takeoff data in a structure that was compatible with
their WBS and labor resources. During the takeoff process modifications will be
made to both the WBS and the crew table. These modifications are easy to
implement with the system once the students get back on the computers.
The
instructor will want the students to turn in a fully documented hard copy of all
the estimate documents as well as a disk file with their direct cost database.
The instructor can then combine these databases and use the ANALYSIS module to
find the $42 per .S.F. welded wire mesh and the $1 per C.Y. hand
excavation.
If
the class and/or the estimates are large and the instructor does not have enough
RAM to analyze the data all at once, I suggest that the students be required to
turn in their direct cost databases in two or three files separated by CSI
Division. The instructor could then combine like Divisions and work with these
smaller files.
CONCLUSION
CONEST
is an inexpensive (about the same price as a textbook) construction pricing and
bidding system. It is a medium conducive to teaching good estimating practices
as well as computer skills. Like most good computer software it not only saves
time but aids in the production of a superior product. In this case the superior
product is not only the estimate and bid but the instructor's evaluation of
those documents.
REFERENCES
1.
Tiner, W. Douglas and Buckingham, Winfred L., Construction Planning,
(Texas A&M University, College Station, Texas, Unpublished, 1982), pp. 8.
2.
Tiner, W. Douglas, "Subdivision of work on construction
projects", Project Management, February 1985, (Butterworth
& Co. Ltd., 1985). pp. 13-18.
3.Clough,
Richard H., Construction Contracting, (New York: John Wiley and Sons,
1975), pp. 64-111.