(pressing HOME will start a new search)
![]()
![]()
- ASC Proceedings of the 23rd Annual Conference
- Purdue University - West Lafayette, Indiana
- April 1987 pp 62-67
|
(pressing HOME will start a new search)
|
|
A
NEW NETWORKING METHOD FOR CONSTRUCTION EDUCATION
|
Fabian
C. Hadipriono, Richard E. Larew,
and Charles C.S. Lin |
|
An
innovative construction networking method using a modified fault tree
concept for use in microcomputers is introduced in this paper. The
purpose of the work reported is to enhance construction education in the
areas of scheduling and quality control. The method incorporates
graphical solutions for obtaining the critical path, sequences of
activities and the basic events that have the potential to cause the
delay of any activity in the network. This method can be used for both
deterministic and non-deterministic assessments. It is also able to
determine and to rank the basic events that contribute to the delay of
an activity. An example is presented here emphasizing the use of
microcomputers. |
INTRODUCTION
Several
procedures for applying network analysis to construction projects have been
introduced in the past three decades. Kelley and Walker developed the Critical
Path Method (CPM) in 1956 [7]. Fondahl introduced a precedence technique which
simplifies CPM [1], and has since become a standard tool for modeling
construction projects. The technique is used in education and in practice to
assess project schedules deterministically. A non-deterministic approach for
studying construction schedules is the Program Evaluation Review Technique
(PERT) initiated by Clark et al. [10].
This
paper describes a Modified Fault Tree Networking (MFTN) technique which has been
developed and used as a training tool for modeling both deterministic and
non-deterministic network activities. Fault tree qualitative and quantitative
analyses were initially developed by Watson for the missile launch control
system of the Minuteman [8]. Haasl extended the concept for use in safety
analyses of nuclear power plants [2,3]. Hadipriono modified this concept in a
detailed study of the qualitative fault tree procedures for use in structural
systems [4] and in network analysis [5]. Tirtotjondro used regressed data for
quantitative network analysis [11].
To
facilitate the learning of these new methods by senior level construction
students in Civil Engineering, a computer program has been written for and used
in our course called "Construction Network Analysis." The program,
which is written in BASIC for use on an IBM PC or XT, has the capability of
performing both qualitative and quantitative analyses, and displays results
graphically. The program is briefly discussed in this paper following sections
which review the development of the MFTN technique.
A
MFTN diagram is a logical and sequential graphical representation of
construction activities, indicating the causality and interrelationship among
the basic events that contribute to a predefined top event. An example of a top
event is the delay of a project according to its late finish schedule (note that
some construction activities have both early and late finish dates.). The
diagram also shows why and how an activity is delayed. An MFTN encompasses the
development of both non-critical and critical activities. A non-critical
activity usually has a flexible deadline date called "slack time" (the
difference between early start/finish and late start/finish dates). A critical
activity, on the other hand, does not have a slack time; therefore, its start
and finish dates can not be extended.
Unlike
the conventional methods of network modeling, the development of MFTN involves a
deductive procedure. The procedure begins with the delay of the last activity
and proceeds deductively to the preceding activities. Suppose a construction
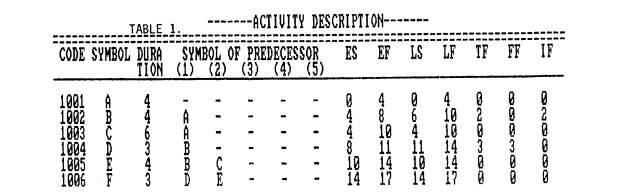
project consists of eight activities, A through F, as listed in Table 1 which
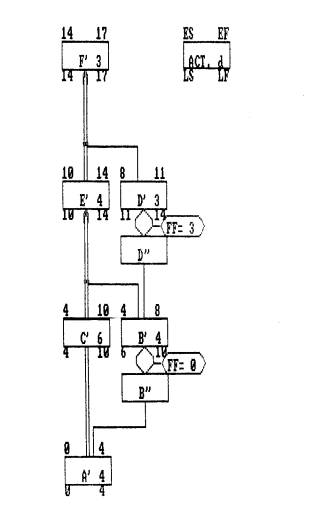
shows activity durations and preceding activities. Assume that the delay of the
last activity F is chosen as the top event (this delay is called event F') as
shown in Figure 1. Table 1 indicates that F' occurs if activity E or D is
delayed (or if El OR D' occurs). Note that an OR gate is used in Figure 1 in
order to relate F' to El and D'. Deductively, El is caused by C' OR B', while DI is caused
by B'. Further deductive analysis of each event will eventually reach the
occurrence of event A', or the delay of activity A.
|
Table
1 |
|
|
|
|
|
Figure
1. An Example of an MFTN |
|
|
|
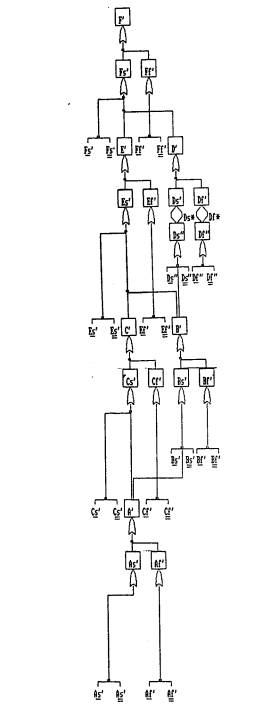
Figure
2. Expansion of MFTN in Figure 1 |
Based
on the diagram in Figure 1 and the information given in the first three columns
In Table 1, we can compute the early start (ES), early finish (EF), late start
(LS), and late finish (LF) dates. These dates are computed using the generally
accepted procedures used in the precedence diagram calculations [6,9]. However,
here we use the terms "bottom-up" and "top-down"
computations Instead of the "forward" and "backward" passes
to determine these dates. The approach used for the precedence diagram
calculations can also be employed here to find the total-float (TF), free-float
(FF), and Interference-float (IF). A TF is the time difference between LS and ES
or between LF and EF of an activity. A TF is usually composed of a FF and an IF.
A FF is the slack time of an activity whose completion will not cause the delay
of any following activity. This float is obtained from the difference between
the EF of an activity and the minimum ES of the following activities. An IF will
result In the delay of any succeeding activity. Thus, an IF is the difference
between TF and FF, and an activity begins to interfere with its follower when
its FF is exhausted. Therefore, activities whose TF is zero (activities A, C, E,
and F) are critical and those remaining (activities B and D) are non-critical.
In Figure 1, the critical path is represented by double lines. Note that since
the delay of a non-critical activity is conditioned upon the exhaustion of its
FF, an INHIBIT gate (hexagon) with the conditional event FF is required.
The
limit to which one develops a tree usually depends on the needs of the project
and the judgment of a student when modeling the activities. For example, If the
need for detailed information concerning either resource constraints (e.g.,
problems with material, labor, and equipment) or environmental constraints
(e.g., bad weather) can justifiably cause a project delay, one may investigate
these basic events and further. expand and include them in the tree.
Consider
the delay of activity F, or event F', in Figure 2 which can be caused by the
following: (1) disturbance of the activity's ES causing the delay of its EF
without the extention of the duration, (2) the delay of the activity's EF
despite its successful ES due to the extention of its duration, and (3) the
combination of both (1) and (2). Event F' can then be expanded through an OR
gate to Fs' and Ff', representing the first and second types of delays (note
that the OR gate takes care of the combination of Fs' and Ff'). The occurrence
of event Fs' is caused by the occurrence of the activity's basic events, and by
events E' and D'. The basic events Fs' and Fs' represent the uncertainties in
the resources and environments, respectively. Similarly, by definition, the
occurrence of event Ff' is caused only by the activity's own basic events.
Similar
procedures can be applied to expand E' and D'. In case of D', which is a
non-critical activity, INHIBIT gates are needed to satisfy the condition
explained earlier. The conditional events associated with the first and second
types of D' are Ds* and Df*, respectively. Figure 2 depicts the MFTN which is
expanded to the basic events of each activity. Clearly, the expanded MFTN is
more complex than the previous one in Figure 1. However, it shows the
interrelationships among the basic events of the activities, and it has the
capability of determining the importance of the basic events as well as
accomodating the non-deterministic nature of the construction activities.
The
importance of activities that configure a project can be determined through the
minimal cut sets (MCS) of the basic events. A MCS is a set of basic events in a
fault tree that guarantees the occurrence of the top event. These MCS are used
by the students to determine possible sets of events that may contribute to the
occurrence of the top event. Furthermore, the MCS list will serve to warn the
student of potential problems that can result in the delay of a project.
Although each MCS contributes to the delay of a construction project, its rank
of importance may be different. The ranking of these potential problems is of
Importance when students plan measures to prevent the delay of a project. Three
methods incorporated in this MFTN concept are used to determine this rank: (1)
qualitative method associated with the criticality and sequence of the
activities, (2) quantitative method associated with the uncertainties involved
in the basic events, and (3) the combination of both (1) and (2).
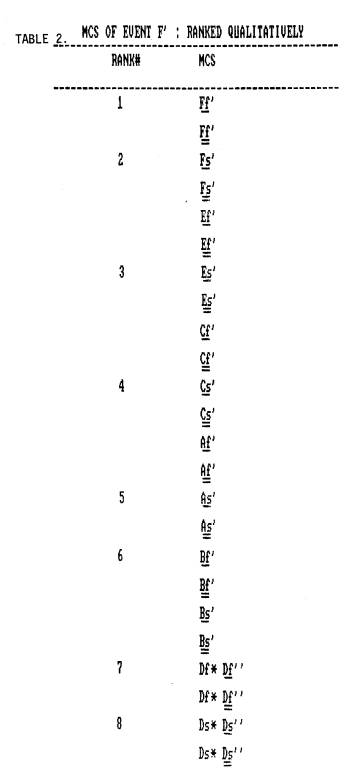
The
qualitative method is derived based on Boolean algebra discussed In earlier
papers [4,5]. The MFTN is first translated into the algebra of events
represented by Boolean expressions. The OR and AND (INHIBIT) gates in the MFTN
are translated into "+" and 11.11 symbols.
Through the use of this algebra, the MFTN leads to a more simplified tree by
eliminating the redundancies when replication of basic events are encountered,
and hence, producing the MCS [4,5]. A list of the MCS for the example discussed
earlier is presented in Table 2. Note that all critical activities are ranked
higher than the non-critical. This is reasonable, since a critical activity does
not have the flexibility to extend its duration. Next, ranking Is based on the
sequential order of the activities. For example, delay of activity F is
considered more important than delay of A, since the former event constitute the
project delay, while the latter can still be recovered if need be. For the same
reason, the second type of delay (e.g., Ff') is considered as more important
than the first type of delay (e.g., Fs'). It can be seen,
however, that the MCS that belong to a certain group of MCS are equally
ranked. For example, Ff' and Ff' are equally important. In order to refine this
rank, a quantitative method is needed.
|
Table
2 |
|
|
|
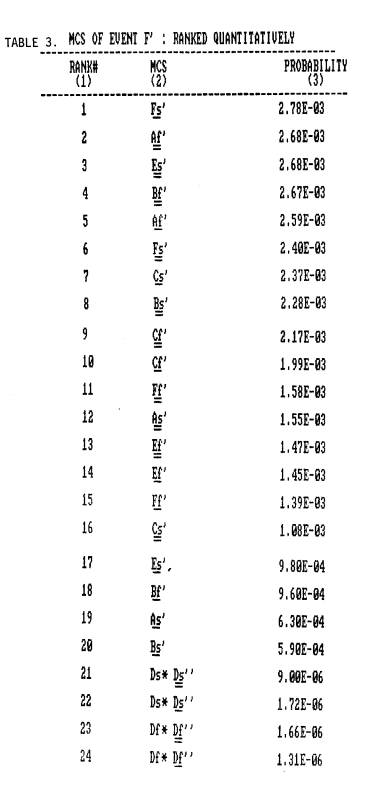
Table
3 |
|
|
The
quantitative method requires the acquisition of construction data. In practice,
the required probability distributions may not be readily available, but
information about each event can be obtained from the construction field and
regression analysis can be performed to obtain the probabilities of occurrence
of the events. Details of the procedure can be found in [11]. The quantitative
ranking for the MCS based on the probability figures is shown in Table 3. Note
that the MCS for the critical activities contains a single basic event, while
that for non-critical contains a pair of basic events. Hence, the probability of
the former MCS is equal to the probability of the individual basic event, while
that of the latter is equal to the product of the probabilities of the basic
events.
Since
the criticality and sequential order of the activities play dominant roles in
project completion, the qualitative ranking is more important than the
quantitative method. However, the latter can be used to refine the former,
particularly to determine the importance of MCS that have equal rank. For
example, since the probability of Ff' is higher than that of Ff', the former is
ranked higher than the latter. Table 4 shows the final rank of importance of the
MCS based on both the qualitative and quantitative methods.
The
MFTN program, written in BASIC language for the IBM PC or XT (64K RAM, 2 disk
drives), consists of 12 subprograms. The user-friendly software can be used by a
student who has little knowledge of either computers or the fault tree concept.
It offers many options through an interactive mode.
The
MFTN program has the capability of displaying the list of activities and
computing the activity dates and floats (see Table 1). It is also capable of
displaying the deterministic fault trees (Figure 1) and expanded fault trees
(Figure 2). Furthermore, it will compute and list the MCS based on a qualitative
analysis (Table 2), a quantitative analysis (Table 3), and both (Table 4). The
information input by a student in order to obtain the fault tree diagrams and
the qualitative analysis includes the duration and predecessor(s) of each
activity. For quantitative analysis, a student also needs to input the
probability of occurrence of each event.
Due
to display limitations, a maximum number of five activities may be used for each
tree level (a total number of five predecessors is allowed for each activity).
However, the program can accomodate over a 100 activities. The benefits of the
program far outweigh this limitation, particularly from an educational point of
view.
|
Table
4 |
|
|
In
this paper, the MFTN technique has been described. Also, a new computer program
for teaching this technique to senior level civil engineering students has been
discussed. The program permits students to perform both deterministic and
non-deterministic studies of construction schedules (well established methods).
In addition, it permits one to use both qualitative and quantitative fault tree
studies (new methods).
The
computer program has the capability to expand and simplify the models depending
on one's needs. It has the flexibility to allow students to determine the limits
of expansion of the tree in accordance with the details of the project analysis.
Hence, depending on the needs, this method provides options for students to
construct either a simple or an expanded tree. Also, one can conveniently
perform a detailed observation of a delay of any activity by isolating related
activities through a subtree construction.
Grateful
appreciation is given to the Office of Learning and Resources at The Ohio State
University which provided funding for this research. The writers wish to thank
Nancy Grace, who edited this paper.
|