(pressing HOME will start a new search)
- ASC Proceedings of the 26th Annual Conference
- Clemson University Clemson, South Carolina
- April 8,9,10l 1990 pp 5-8
|
(pressing HOME will start a new search)
|
|
CONSTRUCTION
EDUCATION GRADUATES--1948-1987
|
David L Bilbo Texas
A&M University College
Station, Texas |
| Construction
education came into existence at Texas A&M in 1944. Through the
decades the program has evolved from a five year 178 credit hour option
under the College of Engineering, School of Architecture, to the current
137 credit hour program which awards a Bachelor of Science Degree in
Building Construction. During the past decade an extensive database has
been generated through surveys in 1982 and 1987. Descriptive data
regarding salary, employment history, and curriculum ratings are
presented on a tri-level grouping: (1) graduates before 1970; (2)
graduates from 1970-1979; and (3) graduates from 1980-1987. |
INTRODUCTION
Construction
education at Texas A&M came into existence in 1944. From its inception the
program experienced a steady growth, reaching a maximum enrollment of 568
undergraduate students in 1985. Since 1985, enrollment figures have slowly
decreased and stabilized near the 450 mark. This growth and stabilization can be
attributed to both the success of the graduates and to the Department's
continual effort to be responsive to the needs of the construction industry. An
integral part of this effort has been follow-up studies of Departmental
Graduates. Throughout the period from 1944 until now, a conscious effort has
been made to assess the strengths and weaknesses of the curriculum by surveying
departmental graduates in the construction industry. Data gathered is not
limited to salary and position information, but also includes ratings of
curriculum offerings, questions regarding continuing education, participation in
professional associations, etc.
Construction
education at Texas A&M was formally established in 1944 under the School of
Architecture and the College of Engineering. It was, at that time, a five year,
178 credit hour option. The degree awarded was a Bachelor of Science in
Architectural Construction.
The
Department of Building Construction came into existence in 1969. At that time,
the School of Architecture was granted college status with Building Construction
being one of five undergraduate departments within the newly formed college.
With this reorganization, the curriculum was changed to a four year, 137 credit
hour program which awarded a Bachelor of Science Degree in Building
Construction. In 1980, the Department of Building Construction made extensive
curriculum revisions in response to the needs of the construction industry for
more "management oriented" graduates.
In
the academic year 1984-1985 the program changed its name to the current
"Department of Construction Science". The program currently enrolls
425 students in the undergraduate program and continues to award a Bachelor of
Science in Building Construction.
THE
SURVEY
During
the Fall Semester of 1982 and again in 1987, a survey was conducted of the
Building Construction/Construction Science students who had graduated since
1948. In the 1987 survey, approximately 1500 graduates received surveys. Of the
number mailed, 493 were returned which had usable data (response rate of 32.8%).
Because of the wide range of graduation dates and shifts in program emphasis,
data was analyzed in three groups:
|
These
groupings are arranged to coincide with the changing status of the department
and curriculum. In 1970, there were extensive modifications made to the program
which had existed as Architectural Construction; in 1980, a somewhat major
curriculum change was made based on the needs of a changing industry. Group 1 is
comprised of graduates from the 19481969 program; Group 2 graduates are from
the 1970-1979 program; and Group 3 from the period 1980-1987. The survey was
designed to provide a view of the graduates and their positions within the
construction industry.
The
same questionnaire was used for all groups with each group's data receiving the
same statistical (descriptive) treatment. Information was analyzed in areas of:
1) salary and job experience; 2) employment information; 3) curriculum content;
and 4) professional development. Data treatment consisted of descriptive
statistics and is available for graphic comparisons both within groups and
between groups.
DATA ANALYSIS
Part 1 Salary and Job Experience
Average
Salaries
Reported salaries were averaged for each of the groups as described prior.
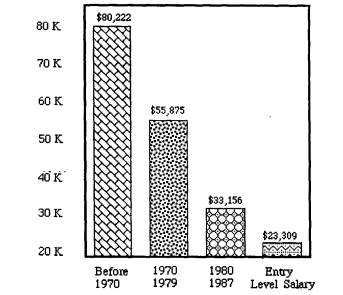
Figure 1 (see page 2) shows the means for graduates from (1) before 1970; (2)
1970-1979; and (3) 1980-1987. To present a better overall view of the salaries
of the groups a salary range table is in Figure 1. The maximum, minimum, and
average salaries are listed for each group. In addition the average entry level
salary from the 1982-1987 graduates is shown in the bar chart.
|
| Figure
1
SALARIES - Average and Range 1948-1987 Graduates |
Salary
Distribution
Figure 2 (see page 2) shows the distribution of reported salaries for all
graduates. It is noteworthy that only 2.7% listed salaries under $20,000; 78.4%
earn from $20,000 to $50,000; and 97.3% of all graduates are earning more than
$20,000. Further information regarding salaries is shown in the frequency
distribution chart at the bottom of Figure 2.
|
FREQUENCY DISTRIBUTION
|
| Figure
2
SALARY DISTRIBUTION All Respondents |
Job Experience
Information
gathered included questions relating to on-the-job experience. Basically, this
was broken into three categories:
|
Figure
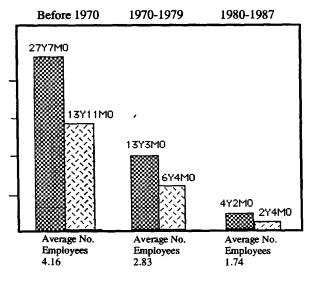
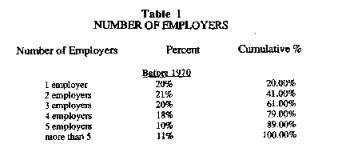
3 shows items (a) and (b) for each of the graduate groupings. It is interesting
to note that all groups, including the most recent graduates, showed a tendency
toward job mobility. Table 1 reveals the tendency of job mobility more clearly.
|
| Figure
3
YEARS EXPERIENCE YEARS WITH CURRENT FIRM Average
Number
of employees |
|
Salary and Job Experience Summary
The
graduates from before 1970 have an average of 27 years and 7 months of on-the
job experience; an average of 13 years and 11 months of experience with their
current firm and have been employed by an average of 4.16 firms. Their average
salary is $80,222.
From
the period 1970 to 1979, the graduates have an average of 13 years and 3 months
experience with 6 years and 4 months spent with their present firm. This group
of graduates has worked for an average of 2.83 employers. Average salary for
these graduates if $55,875.
The
most current group of graduates has an average of 4 years and 2 months of
experience, 2 years and 4 months of which have been spent with their current
employer. They have been employed by an average of 1.74 firms, and earn an
average of $33,156.
Taking
all graduates into consideration, the average on the job experience is 11 years
and 9 months with 7 years and 9 months spent with their current employer. They
have been employed by an average of 2.57 firms, and receive an average annual
salary of $49,592.
DATA ANALYSIS
Part 2 Employment Information
Employment
Breakdown
Each respondent's employment position was placed into one of the following
categories:
|
· Commercial Construction
|
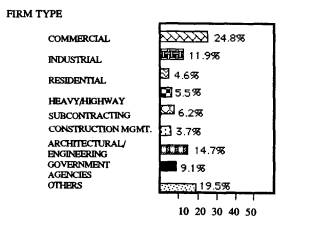
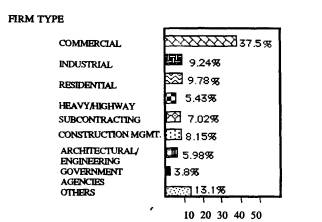
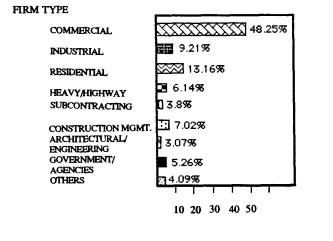
Figures
4, 5, and 6 show the percentage breakdown for each category.
From
this data, one interesting observation is the very high concentration of
graduates employed in the general contracting sector. Using the categories of
commercial, industrial, residential and heavy/highway as the general contracting
sector, employment ranges from 77% for the most recent graduates to 62% for the
1970-1979 group of graduates. For the combined group of graduates, the total
employed by the general contractors still exceeds 70%. With this high
concentration of graduates in the general contracting sector, only a small
percentage (6%) of all graduates are employed by subcontractors.
 |
| Figure
4 EMPLOYMENT
BREAKDOWN Before 1970 |
 |
| Figure
5 EMPLOYMENT
BREAKDOWN 1970 - 1979 Graduates |
 |
| Figure
6 EMPLOYMENT
BREAKDOWN 1980 - 1987 Graduates
|
Employment
Positions
Positions held by graduates of the Building Construction/Construction
Science programs are shown in Figure 7. These positions were listed as the
respondent's primary job responsibility. All percentages are presented in Figure
7 for each group of graduates; however, attention should be brought to the very
high percentages of graduates who are employed as project managers and
estimators. The percentages reflect very high concentrations of graduates in
these positions. Collectively, project management, project engineering and
estimating show concentrations of 44.9% and 37.4% for the 1980-1987 and
1970-1979 graduates respectively. For all graduates, this figure remains high at
approximately 40%.
Employment Information Summary
Combining
this data from the employment breakdown with this information leads to the
following observations: Considering all graduates, the data reveals that over
70% of the graduates work in the general contracting sector. These graduates are
concentrated in the areas of project management, estimating and project
engineering. As job experience increases, there is a gravitation away from the
areas of estimating and project engineering in favor of middle/upper management
and private ownership.
|
|
|
Figure
7
EMPLOYMENT POSITIONS |
The
tendency toward private ownership is shown to increase with time since
graduation. Just over five percent (5.14%) of the most recent group of graduates
are owners or part owners of firms. This increases to 20.4% for the graduates
from the 19701979 group, and peaks at 38.1% for graduates before 1970.
DATA ANALYSIS
Part 3 Curriculum Content
Curriculum
Content
For the purpose of having graduates rate the curriculum offered by the
Department of Building Construction/Construction Science, nine areas or clusters
of courses were identified as follows:
|
Each
respondent was asked to rate each of the curriculum areas from I to 5. Values
assigned to these ratings are:
|
Figures
8 through 10 show how each group rated these content areas. Figure 11 shows the
comparison of the content ratings for all groups. The average ratings for each
content area are all relatively close between groups and a consistent pattern
can be seen. Using average ratings as the criteria for ranking course content,
rankings are shown in Table 2.
|
|
|
Figure8
CONTENT
RATINGS Before 1970 |
|
|
| Figure 9 CONTENT RATINGS 1970 - 1979 GRADUATES |
|
|
|
Figure
10
CONTENT RATINGS 1980 - 1987 GRADUATES |
|
|
|
Figure11
COMPARISON of CONTENT RATINGS |
Curriculum Content-Summary
Of
all curriculum areas rated, the areas of (a) Professional/ Managerial, (b)
Estimating/Scheduling, and (c) Materials/ Methods, continually appear at the top
of the rankings (See Table 2). Graduates who have been on the job for longer
periods of time rate most of the general studies content higher than do the more
recent graduates. Even though these areas are rated lower as a whole, only a
very small percentage of the total graduates indicated a need for less emphasis
of the general studies. It appears while curriculum areas which deal directly
with the construction industry are immediately perceived as more important, the
importance of the general studies content evolves over an extended period of
time.
| Table
2
RANKINGS of COURSE CONTENT |
|
| Rank |
Content
Area |
| |
Before
1970 |
|
1 |
Professional//Managerial |
|
2 |
Materials/Methods |
|
3 |
Math |
|
4 |
Structures |
|
5 |
Estimating/Scheduling |
|
5 |
Legal
Aspects |
|
7 |
English/Humanities |
|
8 |
MechanicalElectrical |
|
8 |
Sciences |
|
Rank |
Content
Area |
|
|
1970-1979
Graduates |
|
1 |
Estimating/Scheduling |
|
2 |
Materials/Methods |
|
3 |
Professional//Managerial |
|
4 |
Legal
Aspects |
|
5 |
Math |
|
6 |
Structures |
|
7 |
MechanicalElectrical |
|
8 |
Sciences |
|
Rank |
Content
Area |
|
|
1980-1989
Graduates |
|
1 |
Estimating/Scheduling |
|
2 |
Professional//Managerial |
|
3 |
Materials/Methods |
|
4 |
Legal
Aspects |
|
5 |
Math |
|
6 |
English/Humanities |
|
7 |
MechanicalElectrical |
|
8 |
Structures |
|
9 |
Sciences |
Respondents
were asked which curriculum areas needed to be emphasized less. Response to this
question was minimal and in insignificant numbers. Each curriculum area took its
share of the few responses indicating a need for "less emphasis".
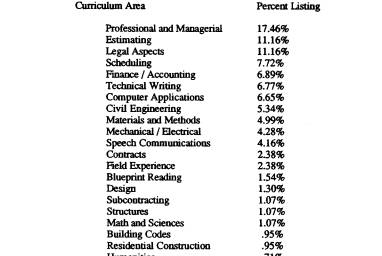
Graduates
were then asked which curriculum areas needed to be emphasized more. Unlike the
previous question regarding "less emphasis", this question drew
substantial response (842). Percentages for each of the nine curriculum areas
plus those areas added by the graduates are listed in Table 3.
| Table
3 CURRICULUM
AREAS for INCREASED EMPHASIS |
 |
DATA ANALYSIS
Part 4 Professional Development
Each
respondent was asked about their continuing education. Table 4 reflects the
responses to these questions.
| Table
4 PROFESSIONAL
DEVELOPMENT |
 |
CONCLUSION
The
conduct of this study included surveying in excess of 1500 graduates. The
information sought was general in nature and encompassed a broad spectrum of
concepts. Usable responses totaled approximately 33%, thus providing a
representative sample from Departmental graduates since 1948.
Analysis
consists of descriptive statistics for each group of graduates. Several
observations are available to the reader, many more than are specifically
mentioned in the text. The graphic presentation of the data allows a variety of
comparisons and contrasts to be made visually. Certainly the survey does not
answer all questions regarding construction education graduates; hopefully it
generates questions, provokes contemplation, and provides information relevant
to construction education's future scope and purpose. Information gathered in
this survey, together with future data is an integral part of the effort to
provide undergraduate construction students with the best possible academic
program.